6 Best Practices to Keep a .NET Application's Memory Healthy

Memory problems in a big .NET application are a silent killer of sorts. Kind of like high blood pressure. You can eat junk food for a long time ignoring it until one day you face a serious problem. In the case of a .NET program, that serious problem can be high memory consumption, major performance issues, and outright crashes. In this post, you’ll see how to keep our application’s blood pressure at healthy levels.
How do you know if you have healthy memory usage? And what do you need to do to keep it healthy? That’s exactly what this article is about. We’ll go over 6 best practices to keep memory healthy and to detect a problem if it occurs. You’ll also see best practices to optimize garbage collections and make your application very fast.
1. Objects should be collected as fast as possible
To make your program work fast, the prime objective is to have objects collected as soon as possible. To understand why it’s important, you need to understand .NET’s generational garbage collector. When objects are created with the new clause, they are created on the heap in Generation 0. That’s a very small space in memory. If they’re still referenced when there’s a Gen 0 collection, they are promoted to Gen 1. Gen 1 is a bigger memory space. If they’re still referenced when there’s a Gen 1 collection, they are promoted to Gen 2.
Gen 0 collections are the most frequent and are very fast. Gen 1 collections go over both Gen 0 memory space and Gen 1 memory space and they are more expensive. Gen 2 collections include the entire memory space including the Large Object Heap (LOH). They are extremely expensive. The GC is optimized to have many Gen 0 collections, fewer Gen 1 collections, and very few Gen 2 collections. But if you have many objects that get promoted to a higher generation then you’ll have the reverse effect. This leads to memory pressure (aka GC Pressure) and poor performance.
By the way, the allocations of new objects are extremely cheap. The only thing you need to worry about is the collections.
So how to have objects collected in a low generation? Simple, just make sure they aren’t referenced as quickly as possible. Some objects, like singletons, have to be in memory forever. That’s fine, they’re usually going to be services that don’t consume a lot of memory anyway.
2. Use caching… but carefully
Mechanisms like caching are troublesome by definition. Those are long-lived temporary objects that are probably going to be promoted to Gen 2. While that’s bad for GC pressure, it’s usually worth the price because caching can really help performance. But you have to keep an eye on it.
One way to relieve some of that memory pressure is by using mutable cache objects. That means that instead of replacing a cache object, you would update an existing object. Which will mean less work for the GC promoting objects and initiating more Gen 0 and Gen 1 collection.
Here’s an example. Let’s say you’re caching stock items from your online grocery store. You have a cache mechanism that stores prices and data for frequently queried items. Like those frozen pizzas that cause high blood pressure. Let’s say that every 5 minutes you have to invalidate the cache and re-query the database in case the details changed. So in this case, instead of creating a new Pizza object, you would change the state of the existing object.
3. Keep an eye on % Time in GC
If you want to find out just how much garbage collections hurt the execution time, it’s pretty easy to do. Simply look at the performance counter .NET CLR Memory | % Time in GC. That’s going to show which percent of the execution time is used by the garbage collector. There are many tools to look at performance counters. In Windows, you can use PerfMon. In Linux you can use dotnet-trace . To find out more, check out my article Use Performance Counters in .NET to measure Memory, CPU, and Everything .
I’m going to give you some magic numbers but take these with a grain of salt because everything has its own context. For a big application, 10% time in GC is probably a healthy percentage. 20% time in GC is borderline, and anything more means you have a problem.
4. Keep an eye on those Gen 2 Collections
Other than % Time in GC, the other big metric you should monitor is the number of Gen 2 collections. Or rather the rate of Gen 2 collections. The objective is to have as few of them as possible. Consider that those are full memory heap collections. They effectually freeze all threads of the application while the GC collects everything.
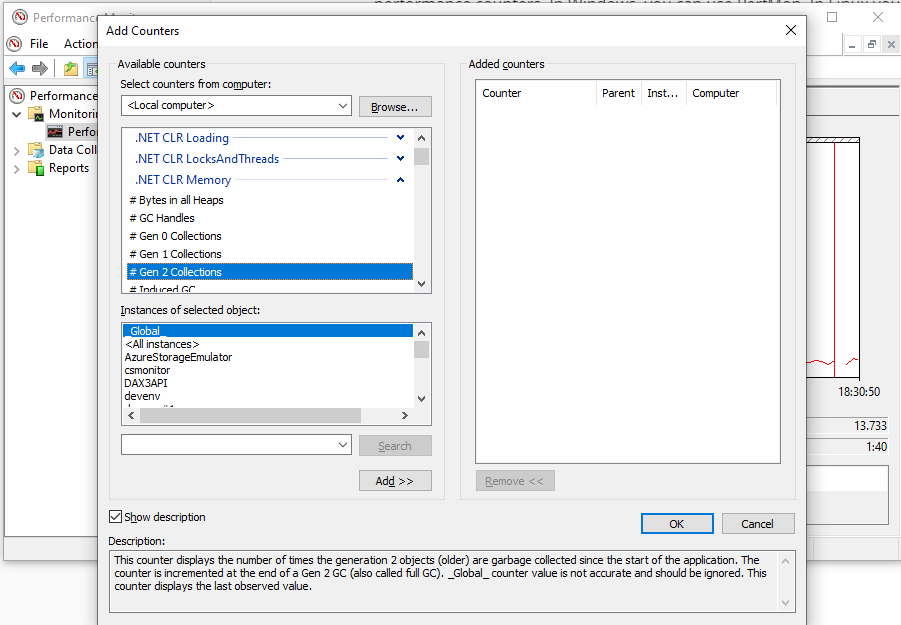
I can’t put a magic number on how many Gen 2 collections you should have. But I suggest to actively monitor for that number every once in a while, and if the rate rises then you probably added some very bad behavior. You can see that number with the performance counter .NET CLR Memory | % Gen 2 Collections
5. Monitor for steady memory consumption
Consider a regular state of an application. Some things happen all the time. It might be a server that serves requests, a service that pulls messages from a queue, a desktop application with a lot of screens. During this time your application constantly creates new objects, performs some operations, and then frees those objects and returns to a normal state. This means that memory consumption should be more or less the same in the long run. Sure, it might reach high levels in peak time or during heavy operation, but it should return to normal once it’s done.
But if you monitored a lot of applications you probably know that sometimes memory rises over time. The average consumption slowly rises to higher levels, even though it logically shouldn’t. The reason for that behavior is almost always memory leaks . That’s a phenomenon where an object isn’t used anymore but for some reason, it’s still referenced and thus never collected.
When an operation causes objects to leak, more memory is consumed with each such operation. With time, the memory rises. When enough time passes, the memory gets near its limit. In a 32-bit process that limit is 4GB. In a 64-bit process, it depends on the machine constraints. When we’re so near the limit, the garbage collector panics. It starts triggering full memory Gen 2 collections for every other allocation so as not to run out of memory. This can easily slow down your application to a crawl. When even more time passes the memory does reach its limit and the application crashes with a catastrophic OutOfMemoryException. There you have it—the equivalent of a heart attack.
To make sure you don’t reach this state of affairs, my advice is to actively monitor for memory consumption over time. The best way to do that is to look at the performance counter Process | Private Bytes. You can do it easily with Process explorer or with PerfMon.
6. Periodically look for memory leaks
The #1 culprit of memory problems is without any doubt memory leaks. It’s easy to cause them, they can be ignored for a long time, and they cause a ton of damage eventually. Fixing memory leaks at the stage your application crashes consistently is very difficult. You’ll have to change old code which can cause all sorts of regression bugs. So I would add a second prime objective to an application with healthy memory: Fix and avoid memory leaks.
It’s not realistic to expect your team to never introduce memory leaks. And it’s not practical to check for memory leaks throughout the application with each new commit. Instead, I suggest adding the practice of checking for memory leaks every once in a while. It might be weekly, monthly, or quarterly. Whatever works for you.
One way to go about it is to check for memory leaks every time you see rising memory (as suggested in Tip #5). But the problem with that is that leaks that have a low memory footprint also cause a lot of issues. For example, you might have objects that should have been collected but remain alive and still have code executing in them, which results in incorrect behavior.
The best way to detect and fix memory leaks is by using a memory profiler. See how to do that in my article Demystifying Memory Profilers in C# .NET Part 2: Memory Leaks .
To see what kind of design patterns lead to memory leaks, check out my article 8 Ways You can Cause Memory Leaks in .NET .
Summary
So there you have it, a recipe for a healthy memory state. If you follow those recommendations, your application will be fast and consume little memory. But seriously though, please eat healthy food and exercise 🙂