
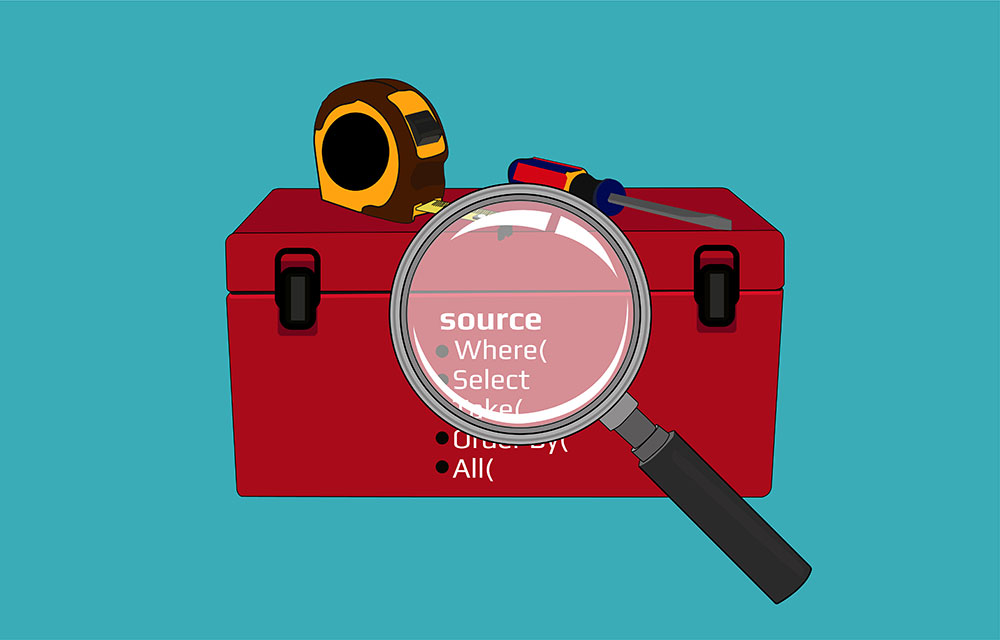
How to Debug LINQ queries in C#
LINQ is one of my favorite features in C#. It just makes the code look nicer. Instead of tedious foreach loops, we got a neat functional syntax that’s easy to write and understand. Well, at least if we’re using the method syntax flavor of LINQ. LINQ is also terrible to debug. We have no way of knowing what goes on inside that query. We can see the input, we can see the output, but that’s about it.

My Christmas Wish List from Visual Studio and the C# Build System
We have a pretty great ecosystem for C# and .NET. We have amazing IDEs like Visual Studio, a fast runtime, good troubleshooting tools, etc. But I think we can do much better. I think the .NET ecosystem can be somewhat inspired by the development process in JavaScript and TypeScript projects. I’m talking about Visual Studio, MSBuild, and the .NET SDK being a closed ecosystem, whereas in JavaScript there’s an open ecosystem that enables amazing extensibility by the community.

6 Hidden Productivity Gems in Resharper and Rider
Six productivity tips when using ReSharper or Rider

5 Productivity Tips in Visual Studio That You Should Know
If you're like me, then you're addicted to productivity tools. That's one of the reasons why I love Visual Studio—it has an endless amount of productivity tricks. This post is going to show five such tricks that help in my work every day.
5 Tricks You Should Know About Visual Studio’s Immediate Window
The Immediate Window looks pretty straightforward, but it hides some cool features. In this post, I’ll show you five tricks you can use with this window that you absolutely should know if you want to debug faster.

Understanding How Assemblies Load in C# .NET
We are constantly dealing with libraries and NuGet packages. These libraries depend on other popular libraries and there are a lot of shared dependencies. With a large enough web of dependencies, you'll eventually get into conflicts or hard situations. The best way to deal with such issues is to understand how the mechanism works internally.

Debugging 3rd Party .NET Code without symbols in Visual Studio
It's not so rare to see weird things happen in 3rd party library code. Call some method and you've got a strange exception. Or an incorrect behavior or even a process crash. It sure would be nice to debug some of these issues. In this article we're going to do just that - You'll see how to debug 3rd party library code in Visual Studio.

Debug & Catch Exceptions in Visual Studio: The Complete Guide
One of the most important concepts in modern programming is Exceptions. They were introduced in the 60's with LISP and eventually made their way to practically all modern programming languages. This article is an extensive guide to dealing with exceptions in Visual Studio.
Visual Studio Debugging Windows: Watch, Locals, Autos, Immediate, Call Stack and Threads
This tutorial is part of a series: Part 1 – Getting started with Visual Studio Debugging Part 2 – Visual Studio Debugging Tool Windows In the previous tutorial, we saw some of the basics of debugging in Visual Studio. This included Breakpoints, Navigation through code, and Investigating variables with the DataTip and QuickWatch. In this tutorial we will go over all the windows Visual Studio has for debugging.