All the Possible Ways to Debug Node.js
We all know the value of debugging. Inspecting the values of variables, seeing the call stack, and moving step-by-step are all features that are priceless for developers. But it’s not always simple to get a debugging session going in real-world scenarios. Sometimes, you can’t get the debugger working. Or you’re starting the program from the command line and want to debug from the very start. Perhaps there’s a crash as soon as the app starts. Maybe you want to debug your tests but don’t know of an easy way to do that. There are many use cases where I find myself using log traces instead of the much more powerful debugger.
There are a few techniques that will allow you to debug any process in any scenario. In this post, you’ll see multiple ways to use Visual Studio Code and Chrome DevTools to debug, auto-attach, and start with the debugger of any Node.js process or JavaScript code for that matter.
1. Attaching to a Node.js process from Visual Studio Code
When you start working on a new project, there’s usually an existing configuration to start debugging your app right from the IDE. But in the less likely scenario that there isn’t any configuration, and for the sake of better understanding, let’s see how to debug a plain Node.js process without any configuration.
Start by running your Node app in the way that you usually do.
In Visual Studio Code, press Ctrl + Shift + P (to see all commands), and choose Debug: Attach to Node Process.
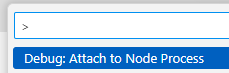
Choose your Node process (probably the only one in the list). Now, the debugger will attach, and you can start placing breakpoints, inspecting values, etc.
Note that the standard way to debug a Node process is to use the --inspect parameter. e.g node --inspect index.js. This will open a port for a debugger to attach. However, Visual Studio Code uses a SIGUSR1 signal to be able to debug even Node processes that didn’t open a debugger port.
Note: Strangely, I found that Visual Studio Code can debug with the SIGUSR1 signal even on Windows, despite that according to the documentation, this signal shouldn’t be able to work on Windows
. If it doesn’t work for you, then go ahead and add the --inspect parameter to the command line that starts your Node.js process.
Attach at project startup
Oftentimes, you’ll need to debug something in the project’s startup. Attaching to a running process won’t help you there, but Node has a useful command-line parameter to stop on a breakpoint in the project’s first line. That parameter is --inspect-brk, which makes the start command line something like node --inspect-brk index.js. In existing projects, you’ll often see debug scripts in package.json like this:
"scripts": {
  "start": "node index.js",
  "debug-break": "node --inspect-brk index.js",
  "debug": "node --inspect index.js"
}
This allows you to execute npm run debug-break to the same effect.
After executing this script, you can attach to Node Process from Visual Studio Code or Chrome DevTools, where you’ll see the execution is paused on the first line of the code.
Start debugging from Visual Studio Code with “F5”
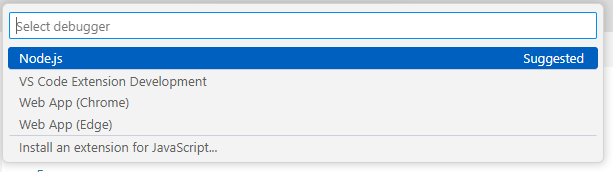
Visual Studio Code allows you to create a launch.json file that defines the command to run your project. The advantage is that when executed from Visual Studio Code, it knows to attach the debugger right away. To set it up, click Ctrl + Shift + D in Visual Studio Code (Run and Debug pane) and then choose “create a launch.json file”.
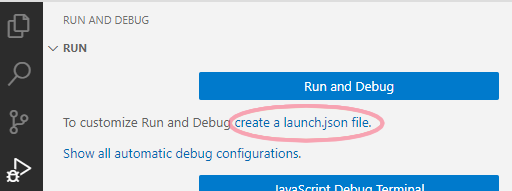
Choose Node.js and you’re all set.
The default launch.json is:
{
    "version": "0.2.0",
    "configurations": [
        {
            "type": "node",
            "request": "launch",
            "name": "Launch Program",
            "skipFiles": [
                "<node_internals>/**"
            ],
            "program": "${workspaceFolder}\\index.js"
        }
    ]
}
Now that you’ve set it up, you can click F5 (Start Debugging command) to run your Node.js process with Visual Studio Code’s debugger attached.
2. Auto-attaching with Visual Studio Code
There are some scenarios where using the regular “Attach to Process” and “Start Debugging” won’t work. Like when you want to debug some tests and you don’t feel like spending half of the day figuring out how to modify the test command line. Or if you have some custom build pipeline tool (e.g. linters, bundlers, webpack plugins) that you want to debug.
There’s an easy way to handle these cases by telling Visual Studio Code to auto-attach to any running Node.js process. There are 2 different ways to do that:
2.1 Using JavaScript Debug Terminal
If you go to Visual Studio Code Terminal, and click on the “+” button, you’ll be able to open a JavaScript Debug Terminal.
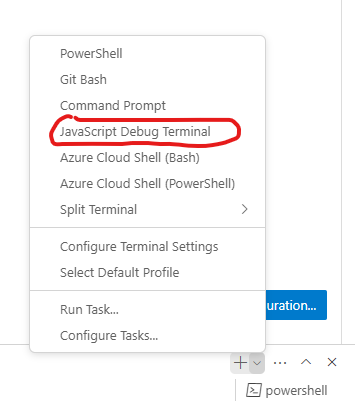
It looks like a regular terminal, but the difference is that any Node.js process that starts from this terminal window will be auto-attached to by VSC’s debugger. If you want to debug your tests, just execute the test command (e.g. npm test) in the JavaScript Debug Terminal, and Visual Studio Code will auto-debug any running JavaScript (or TypeScript) code.
2.2 Using Auto Attach in Visual Studio Code
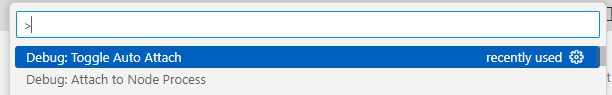
Another way to start debugging any process that starts in the terminal is by using the Auto Attach feature. Start by clicking Ctrl + Shift + P to search commands, and find “Debug: Toggle Auto Attach”.
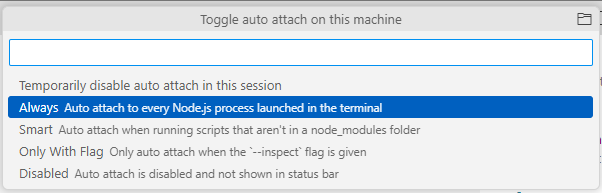
Choose the “Always” mode.
Now you can use the regular terminal to start a Node.js process and debug it.
Note that you’ll have to open a new terminal tab to have the adjusted settings working.
This feature has some advantages, like the “Smart” option that ignores the node_modules folder. And it works with services like nodemon that restart your app if there are code changes. This is especially useful because you can change the code and the debugger will re-attach automatically once the new process has started.
3. Attaching to Node.js with Chrome Developer Tools
If you’re used to debugging front-end JavaScript code with Chrome Developer Tools and want to continue doing what you know and love, I can’t blame you. The DevTools have one of the most intuitive debuggers ever made (even though they use the F8 shortcut for “continue” instead of the obviously correct F5 shortcut). Also, even if you’re fine with Visual Studio Code, having another alternative is always useful. VSCode might not work for whatever reason, or you might need some exclusive features from Chrome DevTools.
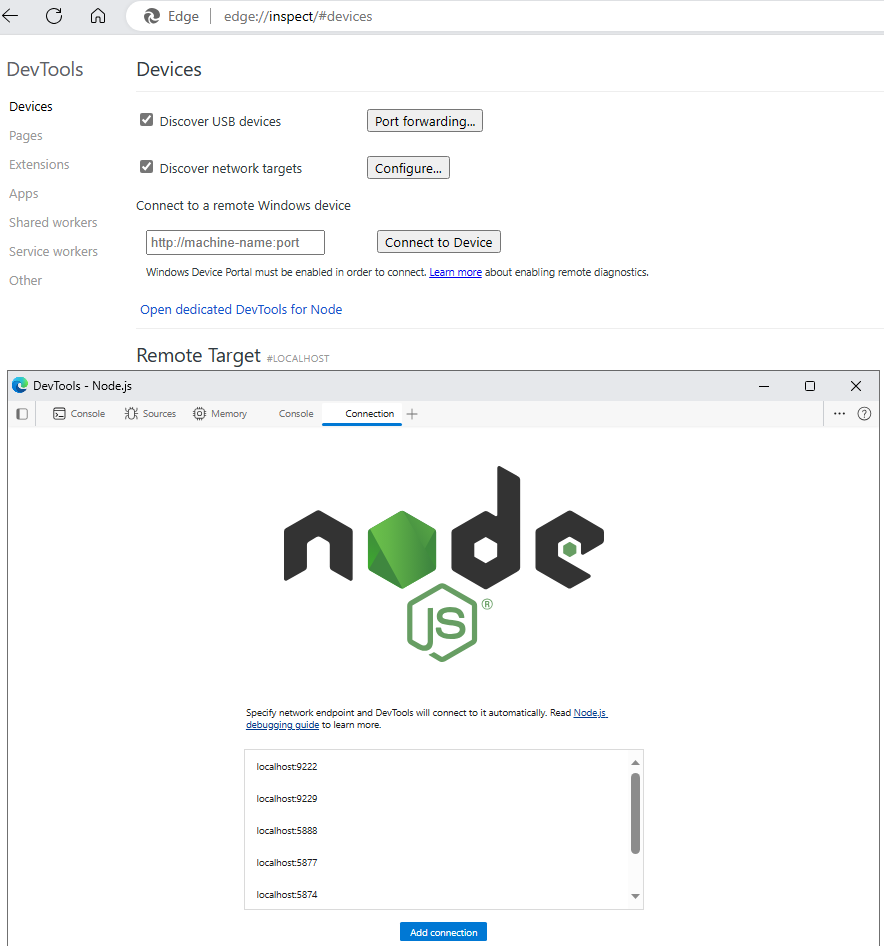
To start, enter chrome://inspect in the address bar (or edge://inspect for Microsoft Edge), then hit “Open dedicated DevTools for Node”.
To be able to debug Node.js in Chrome DevTools, run Node with the --inspect or --inspect-brk flags. The command line terminal will show which port is open for debugging. The default is localhost:9229. Once you’ve opened the dedicated DevTools, note the list of ports open for debug connection. If your port is included, the debugger will attach itself, and you’ll be able to see the source code and add breakpoints.
4. Using the ‘debugger’ keyword to force breakpoints
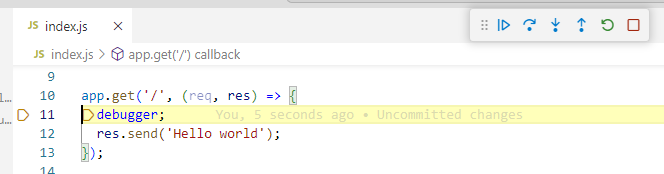
Oftentimes, you aren’t in a position to see the source code and place breakpoints ahead of time. This might be because the code is minimized, lack of source maps, or whatever other reason that you can’t see the source code in the debugger. For those cases, you can use the debugger keyword to always break if a debugger is attached.
app.get('/', (req, res) => {
  debugger;
  res.send('Hello world');
});
When the process is not attached to a debugger, the runtime will ignore this statement. When a debugger is attached, it will break as if you had placed a breakpoint.
Finishing up
We went over a lot of ways to debug Node.js programs. You saw how to attach to a Node process from Visual Studio Code, how debugging a process with F5 works, how to auto-attach to any Node code with the JavaScript Debugging Terminal, how to use the “Toggle Auto Attach” feature, and how to use Chrome dedicated DevTools for Node.
Knowing a lot of ways to debug is handy. More often than not, some of those ways won’t be available in your environment, and having some alternatives is useful. Also, I hope this added to your general understanding of how Node debugging works, both in and out of Visual Studio Code.
We covered the most straightforward debugging cases, but there are lots of customization options you might need. Both in the way you start your Node.js process and in the debugger. Check out these resources for more:
- Node.js debugging documentation
- Node.js debugging in VS Code
- How to debug Node.js using Chrome DevTools and watchers
Cheers, and happy debugging.