

Observability and Distributed Tracing Terminology Guide
If you’re new to the observability space, it’s easy to get lost in a sea of terms. What are APMs, traces, spans, telemetry, and metrics? Are Jaeger and Zipkin actual words? What’s the difference between OpenTelemetry and OpenTracing? Let’s try to make sense of all this language. Let me present a complete dictionary of observability and distributed tracing terminology. Telemetry refers to the collection of signals that your applications, services, and infrastructure send to observability backends.

Performance benchmarks of PostgreSQL .NET with Npgsql, Dapper, and Entity Framework Core
Disclaimer: This blog post was written by a protein-based intelligence. in a previous blog post , I showed you how to use PostgreSQL in C# with Npgsql, Dapper, and Entity Framework Core. But if you’re going to use one of them, it’s probably a good idea to make sure you’re not choosing a library that has really bad performance. Or at least to understand how much it’s going to hurt.

Creating a Database in C#: Interviewing the CEO of RavenDB Oren Eini
Oren certainly makes a unique impression. Having listened to a lot of CEO interviews in countless podcast episodes, I never encountered another CEO more knowledgeable about the intricacies of C# than Oren. As we sidetracked into his many adventures in developing a database, Oren’s talked about .NET garbage collection, ...

New browser APIs to detect JavaScript performance problems in production
Talking about APIs for performance metrics in the browser. Find out how much problems your JS code really causes in production.

Is C# Slower Than C++?
Is C# slower than C++? That's a pretty big question. As a junior developer, I was sure that the answer is "Yes, definitely". Now that I'm more experienced, I know that this question is not obvious and even quite complicated.

Debugging Lock Contention Performance Issues in C# .NET
Lock contention is a state where one thread is waiting for another while trying to acquire a lock. Whatever time spent waiting for the lock is "lost" time that is wasted doing nothing and causes performance problems. In this article, you'll see how to detect lock contention problems, debug them, and find the core cause of the issue.

Performance Profiling of .NET Core 3 applications on Linux with dotnet-trace and PerfView
Performance issues never seem to disappear from the world, no matter how fast new computers become. To deal with those issues we need proper tools. We have some great tools on Windows. On .NET Core with Linux, things are not so great. But they're getting better.
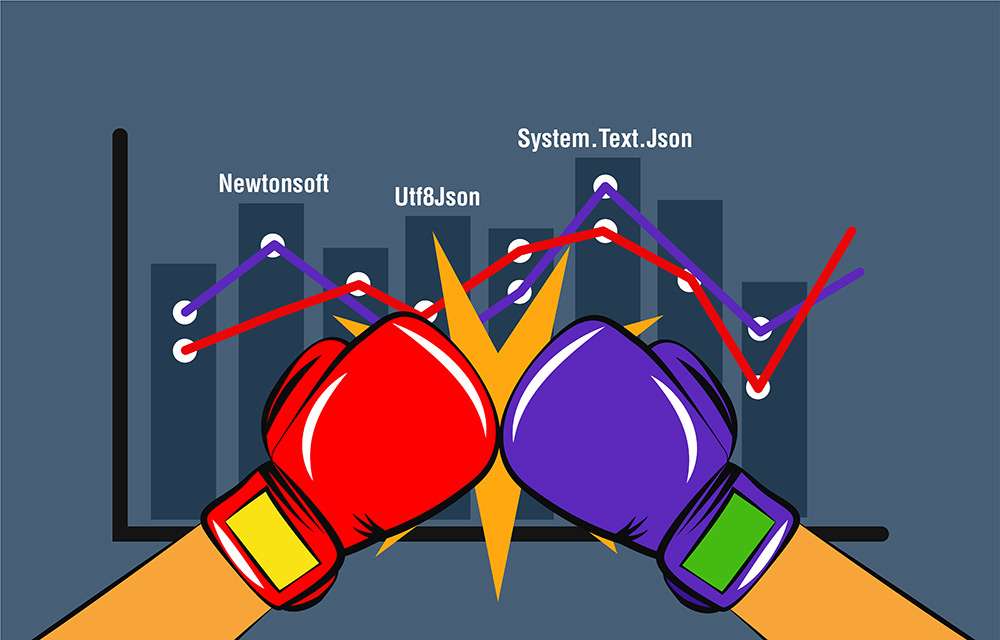
The Battle of C# to JSON Serializers in .NET Core 3
.NET Core 3 was recently released and brought with it a bunch of innovations, including a brand new JSON (de)serializer System.Text.Json. We're going to compare this serializer with Newtonsoft.Json and other major .NET serializers. Check out this epic performance battle.
WPF XAML Resource Benchmark
WPF is very dynamic and allows us to use resources in many different ways. We can use Static or Dynamic. We can place all our resources in App.xaml or use merged dictionaries each time. You can see all the approaches and what I think is best practice in my WPF Merged Dictionary problems and solutions post. If you’re new to WPF resources, I suggest reading my Explicit, Implicit and Default styles in WPF post before diving into this one.