Debug & Catch Exceptions in Visual Studio: The Complete Guide

One of the most important concepts in modern programming is Exceptions. They were introduced in the 60’s with LISP and eventually made their way to practically all modern programming languages.
The simple concept is this: When some kind of error occurs during runtime, the execution will terminate and an Exception will be thrown. This will cause the stack to unwind until an appropriate Exception Handler is found. It’s a brilliant concept really. Here’s an example:
public void Foo()
{
    var item = _warehouse.GetItem(-1);
}
class Warehouse
{
    Item[] _items = new Item[100];
    public Item GetItem(int itemIndex)
    {
        return _items[itemIndex];
    }
}
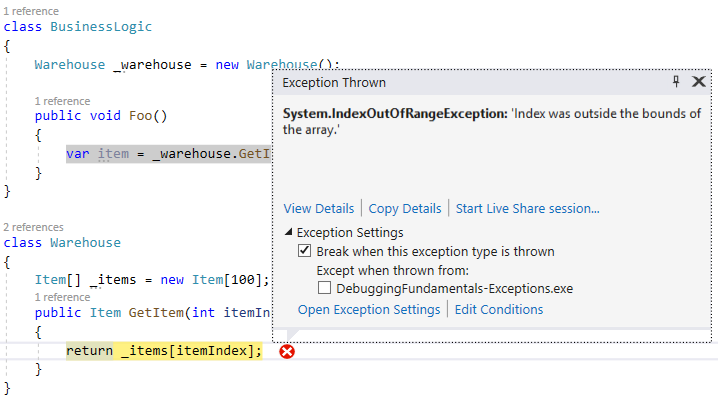
When Foo() is called, it invokes GetItem(-1). This tries to access item -1 in an array. Since -1 is an illegal index, the runtime tells us there’s an error by throwing an exception. In this case, it’s an IndexOutOfRangeException. Here’s how it looks like during debugging:
Handling Exceptions
In the above case, the exception is not handled and will crash the process. But we can handle exceptions and it’s actually standard practice in .NET. It’s done by using the try-catch clause as follows:
try
{
    ...
}
catch (Exception ex)
{
    ...
}
If an exception is thrown within the try statement, the execution will naturally continue to the catch statement. This includes exceptions thrown in inner methods called from the try statement. Caught exceptions are called First Chance Exceptions or Handled Exceptions.
When an exception is thrown, the stack unwinds until a handler is found. That means the runtime looks for a catch statement in the current method first. If not found, it looks for catch in the calling method and goes on all the way up to the “root” method. If not found, it’s considered an Unhandled Exception or Second Chance Exception.

What happens when an Exception is Thrown?
When a Second Chance Exception is thrown, it usually terminates the entire process, depending on some rules:
- When an exception is thrown in the Main thread (In a Console Application or a Desktop Application), from a thread created with
new Thread()or from a thread-pool thread created withThreadPool.QueueUserWorkItem, it will crash the process. - In older .NET 1.0 and 1.1 applications this behavior is different. An unhandled exception in a thread-pool thread will not crash the process. You can configure the application to the older behavior (that is, not to terminate) with some code in configuration file (not recommended).
- When an exception is thrown from a Task created with
Task.Run()orTask.Factory.StartNewit will not crash the process. In this case the exception is handled, just not in user code. - In ASP.NET, an unhandled exception in a thread within a request context will not crash the process. In this case the exception is handled, just not in user code.
When a First Chance Exception is thrown, the execution will not terminate. It will instead continue to the relevant catch clause.
Debugging Exceptions in Visual Studio
When an exception is thrown while debugging, Visual Studio might or might not break at this point to show you the exception details. This depends on your settings in the Exception Settings Window available from Debug | Windows | Exceptions Setting.
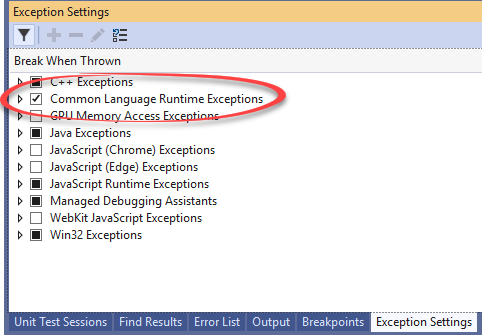
In .NET, we care only about Common Language Runtime Exceptions (CLR Exceptions). Here are the rules of behavior:
- Visual Studio always breaks on second-chance exceptions, even when the CLR Exceptions checkbox is unchecked.
- When the CLR Exceptions checkbox is unchecked, VS will break only on second-chance exceptions.
- When the CLR Exceptions checkbox is checked, VS will break on all first-chance exceptions.
- You can expand the CLR Exceptions checkbox to select which first-chance exceptions VS should break on:
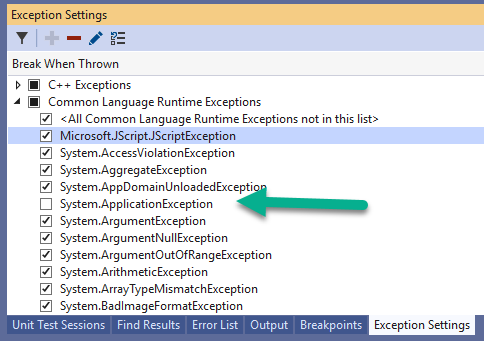
In the above case, VS will not break on System.ApplicationException.
- When an exception occurs, a popup with the exception details appears. It has some of the same options as the exception settings window:
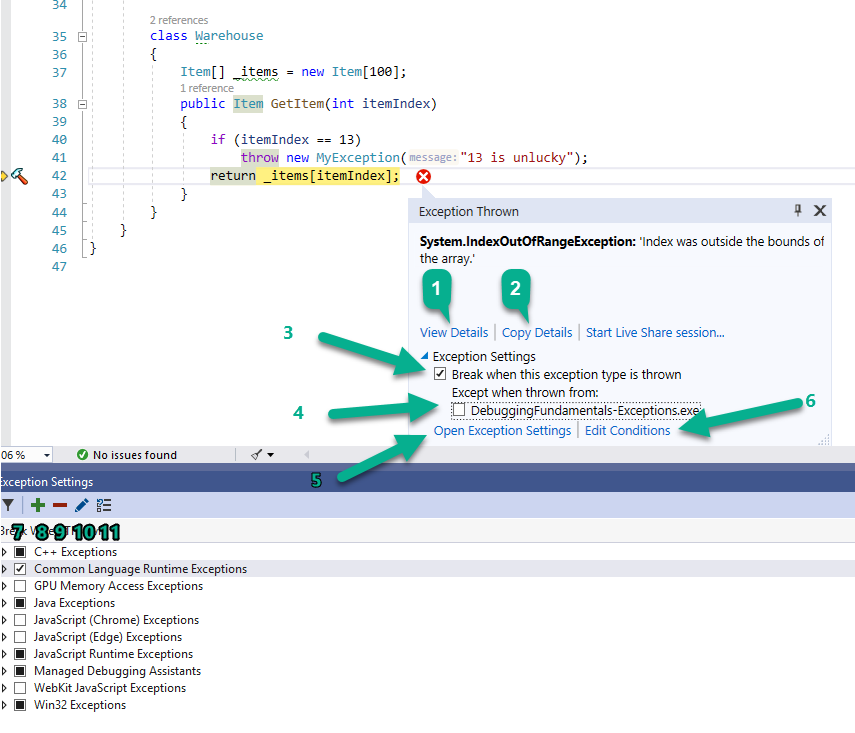
Let’s go over those options:
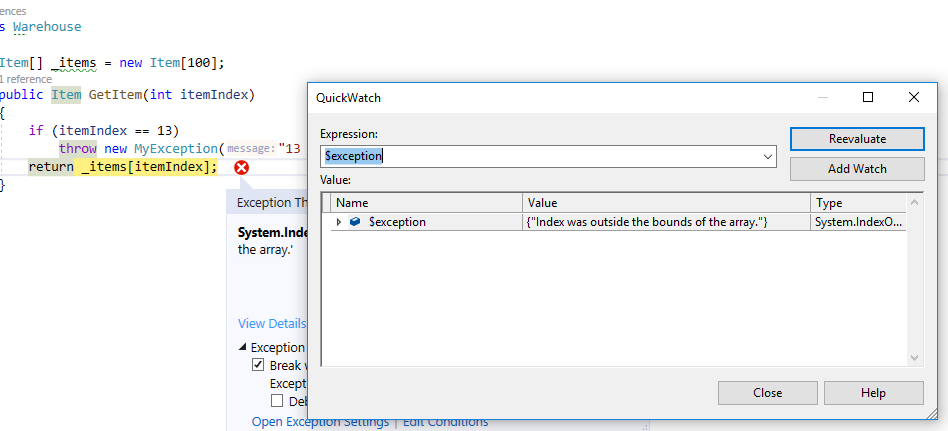
- View Details will open a QuickWatch window with the exception object that was thrown.
- Copy Details copies to clipboard the Exception Type, Message, and Call stack.
- By un-checking “Break when this exception type is thrown” VS will not stop next time on this type of exception (unless it’s a second-chance exception).
- You can add a condition to not break on this type of exception in the current assembly. This can later be edited in the Edit Conditions window available from (6) and (10).
- Opens the exceptions settings window, which is already open in the screenshot.
- Opens the Edit Conditions window.
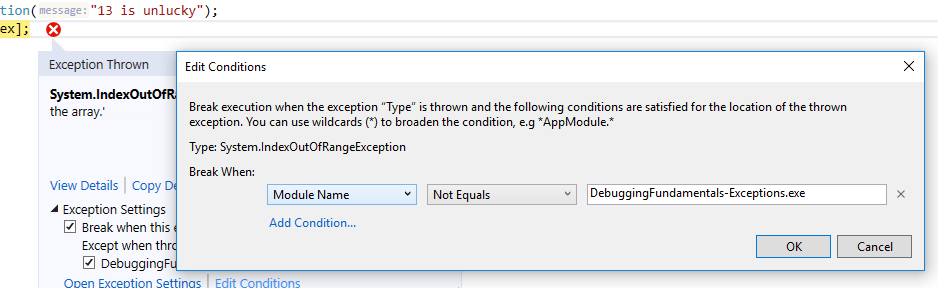
You can add conditions according to Module Name (assembly name).
- Show only enabled exceptions and expand them.
- Add a custom exception to the exceptions list. Useful when you create your own exception classes.
- Delete the selected exception from the list.
- Opens the Edit Conditions window (same as 6).
- Restore the list to default settings.
TIP: The exception settings window is one of the most important debugging windows. You should always be aware whether you are currently breaking on exceptions or not. If you’re experiencing a strange behavior or bug, it’s very likely exceptions are thrown and you’re just not aware of this because your CLR exceptions checkbox is off.
Enable Just my Code
One of the lesser known features in Visual Studio debugging is to Enable or Disable Just My Code. This is actually a very important functionality in some scenarios. You can toggle this options in VS debugging options from Debug | Options.
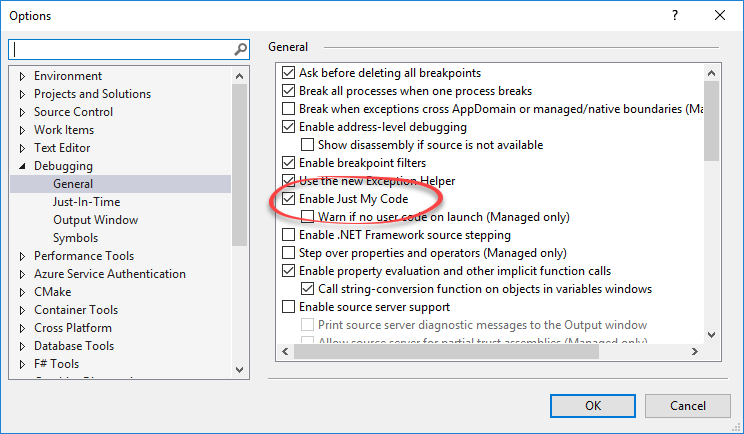
The default value is ON. That is, Just My Code is Enabled. When enabled, Visual Studio will break only on exceptions in your own code. In reality, there are a whole lot of exception being thrown in the process that we aren’t aware of. Those are exceptions in the .NET framework itself and in 3rd party libraries. We usually don’t want to be notified on those exceptions. In fact, turning this on can make your debugging experience terrible since VS will stop every second on irrelevant exceptions.
There are times that we do want to stop on those exceptions. Here are some of those:
- When something strange is going on. For example, a request to your server returns 500 for no apparent reason.
- When you’re calling 3rd party library code and it returns unexpected results.
- When you’re calling 3rd party library code and it throws an exception. By turning off Enable Just My Code you will see more details (the full call stack).
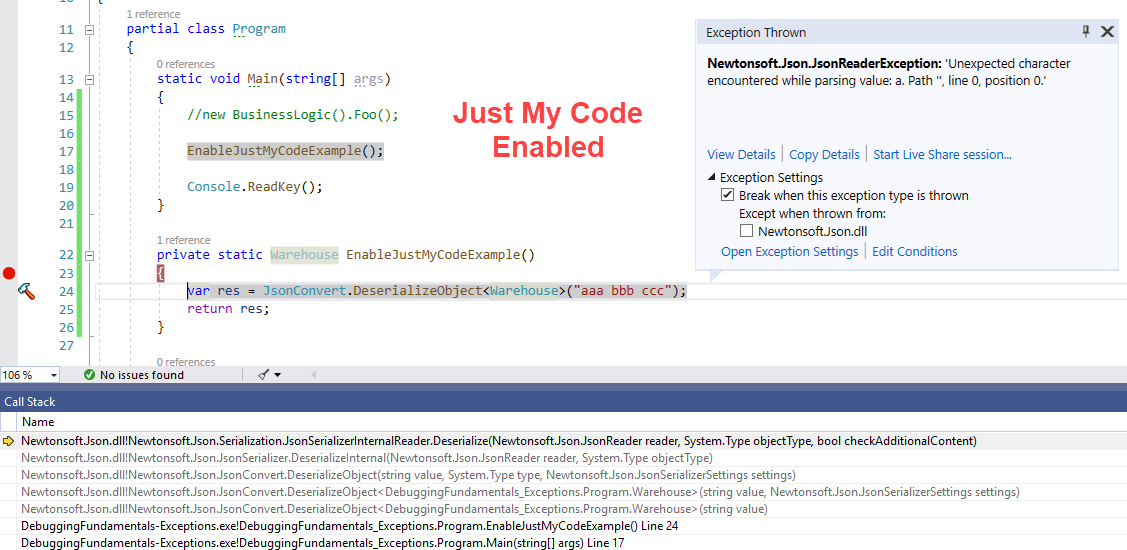
Here’s a simple example with Just My Code Enabled:
Now when disabling Just My Code:
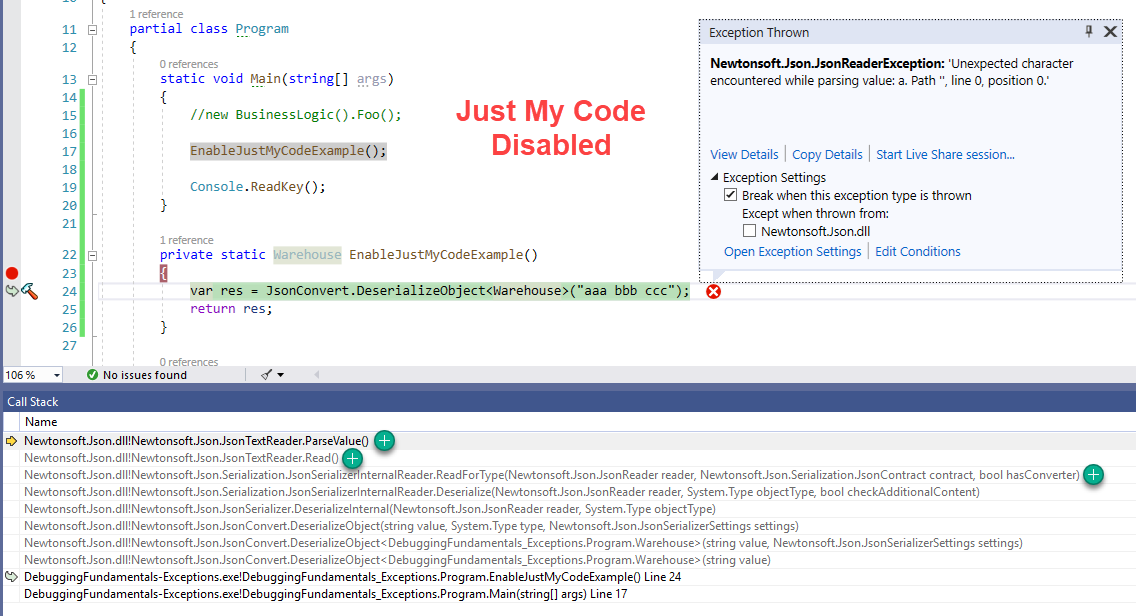
As you can see, when Just My Code is disabled, there’s more to the call stack. In this simple example it might not seem very useful, but this feature can be a lifesaver. The full call stack can give you hints to the problem. In addition, if you’re planning to debug the 3rd party code with a tool like dnSpy , you’ll have a better idea on where to place the breakpoint.
This feature is especially useful for strange unexplained behavior like failed requests for no reason.
Unwind to This Frame
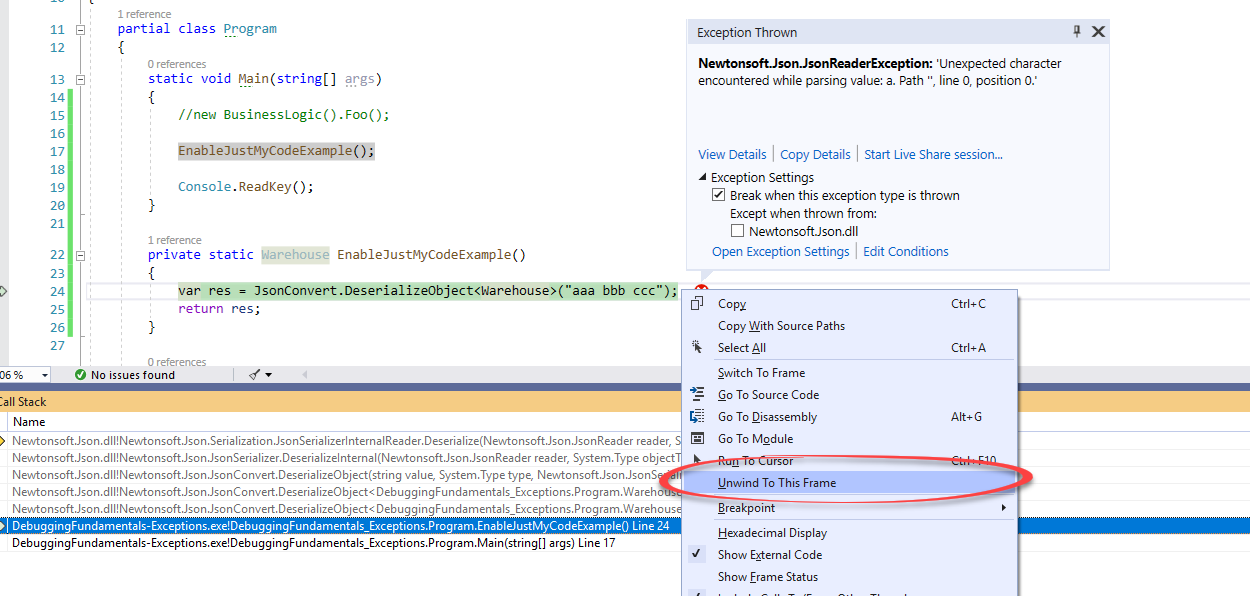
When an exception happens, the debugger’s current location is somewhat special. It’s not on any particular statement, rather it shows the last statement executed before an exception was thrown. In this state, it’s possible to sort of “Go back in time” to a method (aka Frame) in the current call stack before the exception was thrown. This is done from the context menu of the Call Stack window:
After clicking Unwind To This Frame, the exception will disappear and it would seem you are debugging the last statement up to the exception.
This feature is available only when Just My Code is Enabled. You’ll be able to unwind to more frames for unhandled exceptions.
This is useful in several cases:
- For whatever reason, you might want to repeat the scenario. For that, you can unwind to frame and hit Continue (F5). The exception will usually be thrown again.
- You can use Visual Studio’s Edit and Continue feature to edit some code and continue execution. This can save you the trouble of stop debugging, making a change, and running again. You can even Unwind to Frame, then move the debugger’s location (Set next statement (Ctrl+Shift+F10)) to a previous location in code. Then do some editing and see if it solves the problem.
IntelliTrace (Visual Studio Enterprise)
If you’re lucky enough to have a VS Enterprise license, then you can use the all-powerful IntelliTrace .
IntelliTrace allows you to record execution history. That is, you’ll be able to view and “Travel” back in time to recorded Events. What are Events? Well, exceptions, for example, are recorded events. Debugger events like breaking on breakpoints are also events.
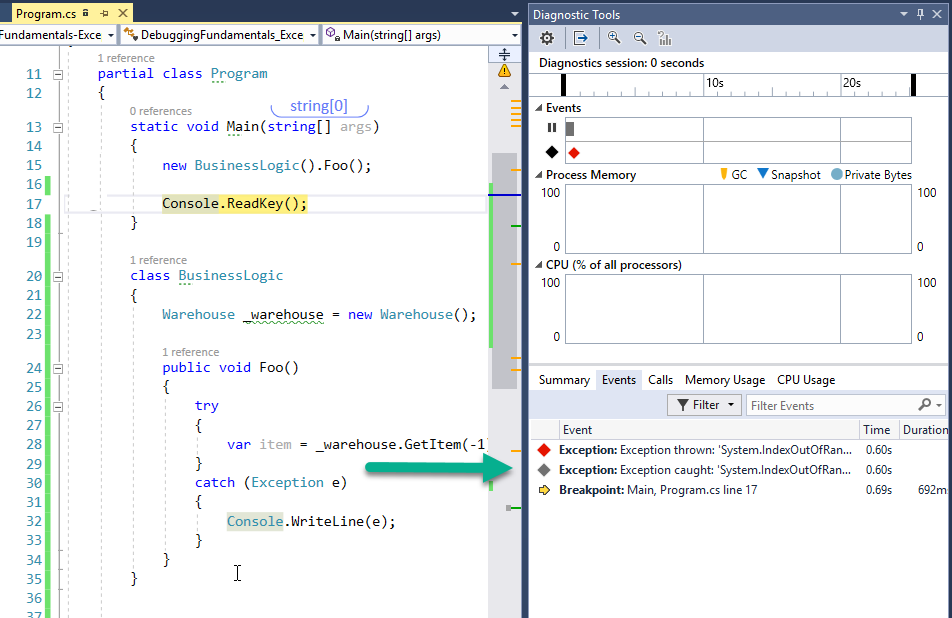
Here’s how the Diagnostics tool window looks like when I stopped on a breakpoint after an exception was thrown:
Now you can actually click on the exception event to enter a special Historical debug mode. Here’s how it looks like:
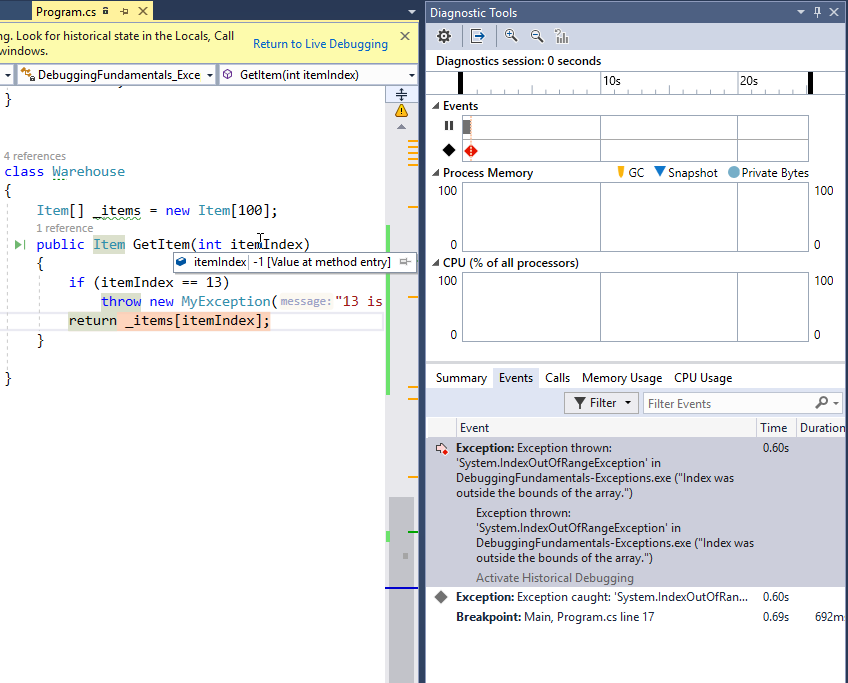
You can now debug as if Visual Studio stopped when that exception was thrown. You can see the call stack and depending on configuration, you can even see the local variables.
There are 2 main modes to configure IntelliTrace, available from Debug | Options | IntelliTrace (you’ll see this only in Enterprise version):
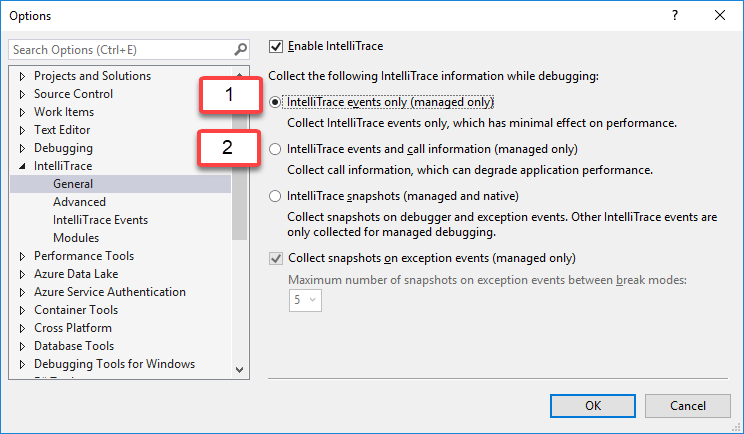
The first mode will record events, but not the call information. So when in this mode, you won’t see local variables like the itemIndex parameter in the picture. The second mode will record call information as well but has more impact on performance.