This tutorial is part of a series:- Part 1 – Getting started with Visual Studio Debugging
- Part 2 – Visual Studio Debugging Tool Windows
In the previous tutorial, we saw some of the basics of debugging in Visual Studio. This included Breakpoints, Navigation through code, and Investigating variables with the DataTip and QuickWatch.
In this tutorial we will go over all the windows Visual Studio has for debugging.
The Watch Window
The Watch Window allows you to see value of variables and expressions while debugging. It’s kind of like the DataTip you get when hovering over a variable, except that you can write any expression you want. It’s available from Debug | Windows | Watch | Watch 1 or Ctrl + Alt + W + 1.
Here’s an example:
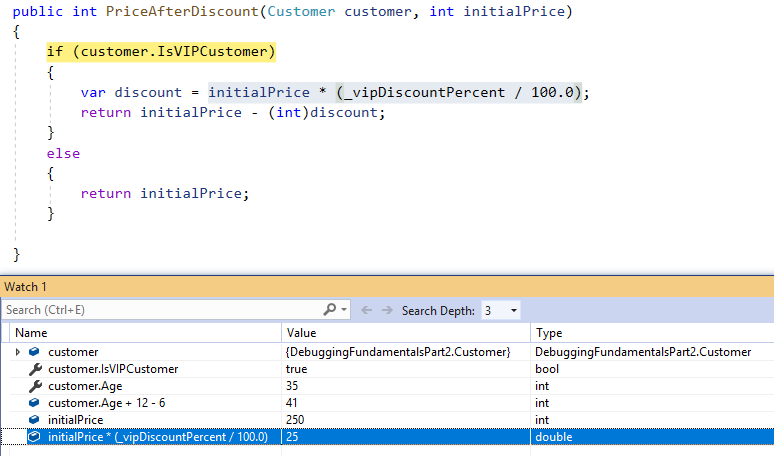
There are 4 watch windows in Visual Studio, which you can use in different contexts (Watch 1, Watch 2, etc.).
Any expression can be entered into the watch window. The same rules apply to expressions as to code. So if you write an illegal expression, you’ll see the same compiler error.
To add items to watch do any of the following:
- Write them manually in a new row of the Watch window
- Right-click on a variable choose “Add Watch” in the context menu
- Right-click on a variable in the DataTip and choose “Add Watch”
- “Add Watch” button from QuickWatch
When to Use the Watch Window:
While the DataTip and QuickWatch are more popular, the watch window is very useful when you need to re-evaluate the same variables and expressions multiple times. This happens if you hit the same breakpoint over and over again, or different breakpoints in the same class. The most common scenario is with a breakpoint inside a loop.
You can use watch window evaluate the Object Id instance we talked about in Part 1. That’s where you create a weak reference to any object, which can be evaluated from anywhere with $1, $2, and so on.
Watch Window Rules and Behaviors
There are some behaviors, rules and features to the watch window.
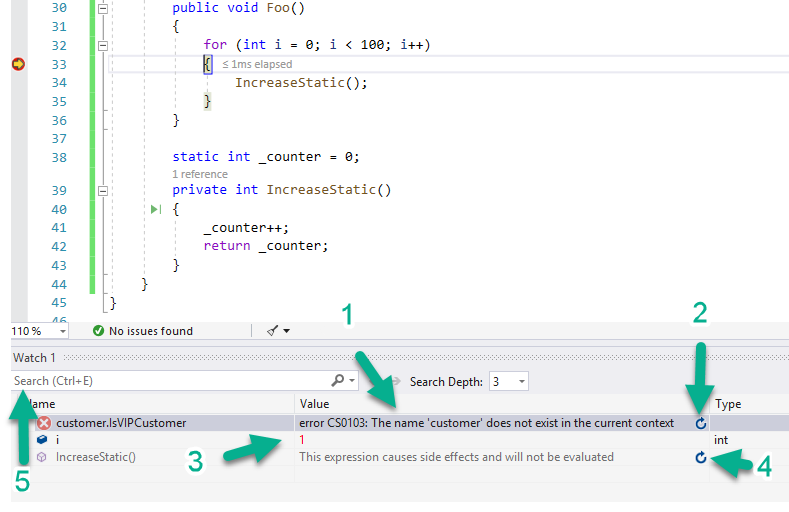
- When an expression can’t compile in the current scope and context, you will see a compiler error.
- You can click the refresh button to try and re-evaluate the expression. Maybe after you’ve edited it and fixed the problem.
- When a value has changed since the last breakpoint, it’s shown in red.
- You can evaluate methods and properties in the watch windows. These can have side effects on the application state. For example, in this code the
IncreaseStatic()method will change a static variable. Side effects are usually unwanted in a debugging session, so Visual Studio notifies you about it before evaluating. Clicking on the refresh button will evaluate the expression, suffering the side effects. - VS 2019 introduced a new feature: Search in the Watch windows, Locals, and Autos windows. It searches through Name, Value, and Type and stops on first match. Search Depth is useful for nested fields and properties in classes.
The Immediate Window
The immediate window is available in the menu from Debug | Windows | Immediate or Ctrl + Alt + i. You can type in any expression and the immediate window will evaluate. It’s kind of like the Watch window, but it acts more like a command line window in Windows or Linux.
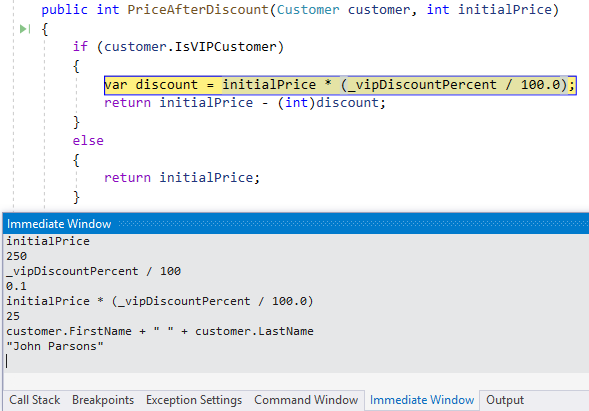
For me, the immediate window was always more convenient than the Watch or QuickWatch windows.
- Like in command line interfaces, you can use the Up/Down arrow keys to paste previous expressions.
- To clear the window, right-click on it and select “Clear All”.
Side Effects in Watch Window, QuickWatch, and Immediate Window
We saw before that evaluating the expression can cause side effects. For example, consider this class:
class MyClass
{
    public int number = 0;

    public int Foo(int a)
    {
        number++;
        return a + 1;
    }
}
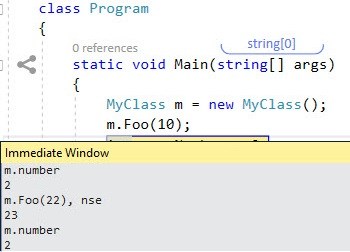
If I evaluate Foo() in the Immediate Window, number will increase and my application state will be changed:
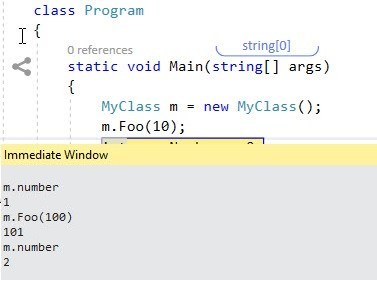
We can see here that m.number increased from 1 to 2.
You can add the , nse (No Side Effects) postfix to an expression, and it will evaluate without changing the application state.
This works both in the Immediate Window and in the Watch Windows.
As you might find out, not all expressions are supported in no-side-effects mode. For example, you can’t do a network request in this mode because there’s no way to guarantee it will have no side-effects.
Locals and Autos Windows
VS offers 2 automatic-watch tool windows: The Locals and Autos windows.
The Locals will show local variables of the current scope. It usually starts with this, which represents the current class.
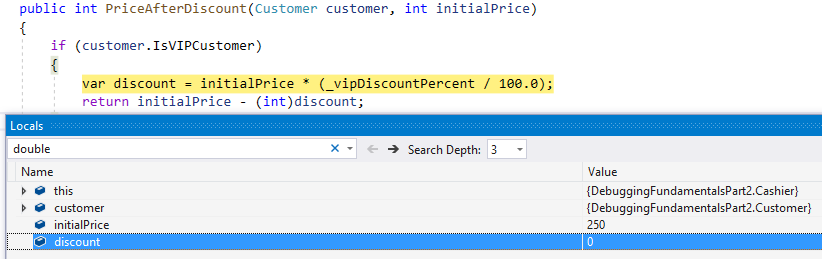
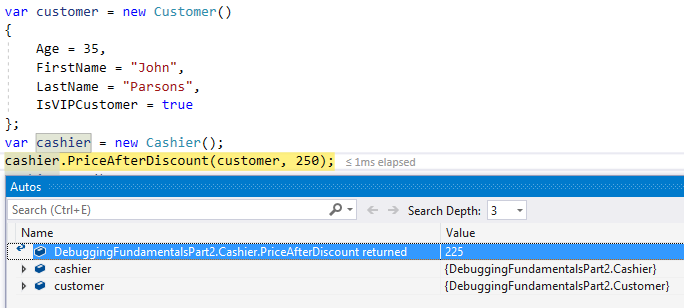
The Autos window will show all variables used in the current line and in the previous line. These could be local variables, class members or static variables. The Autos also shows values returned from methods, which is useful at times.
- In both Locals and Autos, you can double click on any Value field and change the variable’s value. This will actually its value, causing a possibly unwanted side effect.
- Search works same as in the Watch window.
Call Stack Window
One of the most useful tool windows is the Call Stack Window. It shows the chain of methods that called one another, up to the the currently debugged method. For example, suppose you have the following Console Application:
static void Main(string[] args)
{
    var customer = GetCustomer(args);
    var cashier = new Cashier();
    var newPrice = cashier.PriceAfterDiscount(customer, 250);
    // ...

public class Cashier
{
    private double _vipDiscountPercent = 10;

    public int PriceAfterDiscount(Customer customer, int initialPrice)
    {
        if (customer.IsVIPCustomer)
        {
            var discount = GetDiscountForVip(initialPrice);
            return initialPrice - (int)discount;
        }
        else
        {
            return initialPrice;
        }
    }

    private double GetDiscountForVip(int initialPrice)
    {
        return initialPrice * (_vipDiscountPercent / 100.0);
    }
}
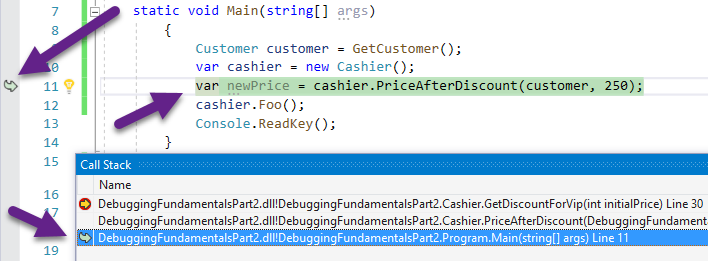
When you place a breakpoint int GetDiscountForVip() the call stack will be:
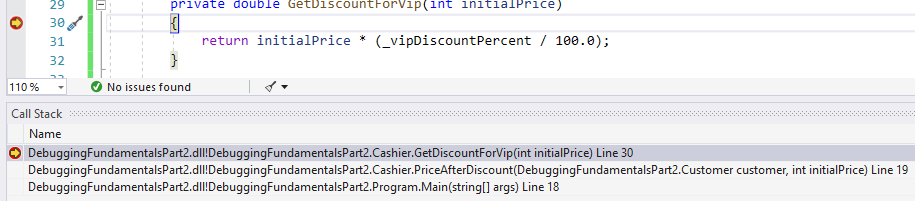
The topmost method is always the current method, which is GetDiscountForVip(). Below it is the method that called it, which is PriceAfterDiscount(). Below that is the method Main, which called PriceAfterDiscount.
You can double-click any method (aka Frame), and you will be navigated to that part in the method:
Note that there’s a greenish arrow on the left. This shows that this is the currently debugged method, but also that it’s not the topmost Frame. While in this mode, you can hover over variables in the current Frame (method) and see their values.
Call Stack Options and Features
Besides the ability to switch frames by double-clicking, you can open the Call Stack’s context menu by mouse right-clicking on any frame.
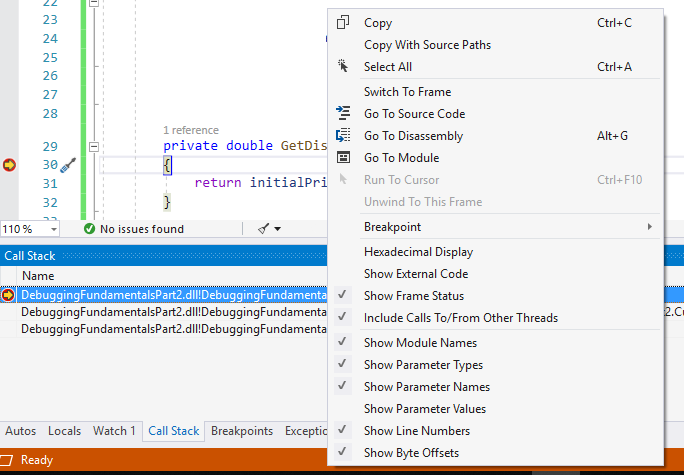
Let’s go over the more interesting options:
- Switch To Frame – Same as double-clicking, switches to selected frame
- Go To Source Code – Navigates the editor to the method’s source code without actually switching the Frame.
- Go To Disassembly – Opens the Disassembly window and shows the selected method. That’s a bit more advanced, but we’ll talk about it later on.
- Go To Module – Opens the Modules Window and select the module in which the selected method is stored. We’ll talk about the Modules window in future tutorials.
- Unwind To This Frame – When an exception is hit, you can “Unwind the call stack”. That’s sort of like going one step back in time, before the exception happened so you can make use of a feature called Edit and Continue. This feature allows to change code live while debugging. In this way, you can theoretically change the code so as to prevent the exception from happening. We’ll talk more about exceptions in the next part of the tutorial.
- Breakpoint – Allows to add a breakpoint where this method was called (in the invocation). Or, alternatively, insert a Tracepoint. That’s a breakpoint that prints to the output window and continues execution.
- Show External Code – When checked, you will see Frames from Modules that are not your own source code. This might the .NET framework itself, or from some 3rd party library you are using. Very useful feature for advanced scenarios.
- Show X – Allows to include a lot of interesting information within the window itself. You can usually get this by switching to Frame, but it’s a useful visualization.
Threads Window
The Threads Window is the final tool window in what I call the Truly Vital Debugging Windows group. This window shows all the currently active threads, and allow to switch between them.
Consider this code:
class Counter
{
    private int _counter;

    public void StartCount()
    {
        _counter = 1;
        Task.Run(IncreaseCounter);
        Task.Run(DoubleCounter);
        Task.Run(LogCounter);

    }

    private void IncreaseCounter()
    {
        while (true)
        {
            Interlocked.Add(ref _counter, 1);
            Thread.Sleep(15);
        }
    }

    private void DoubleCounter()
    {
        while (true)
        {
            var counterNow = _counter;
            Interlocked.Add(ref _counter, counterNow);
            Thread.Sleep(200);
        }
    }

    private void LogCounter()
    {
        while (true)
        {
            Console.WriteLine(_counter);
            Thread.Sleep(500);
        }
    }
}
When run, 3 methods will execute in parallel. IncreaseCounter will keep increasing _counter by 1. DoubleCounter will multiply _counter by 2. LogCounter will print its value every 500 milliseconds.
When stopped on a breakpoint in LogCounter, you will be able to see all 3 running thread.
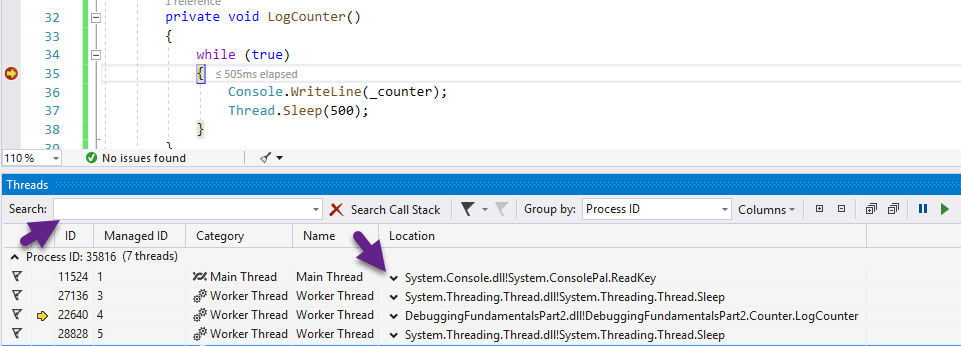
- You can switch between threads by double clicking the row.
- To see the Call Stack of a thread, you can switch to a threads and then open the Call Stack window. Alternatively, the Threads window has a little arrow between the Name and Location column that allows you to see the call stack.
- You can Search the call stack for namespaces, names of methods, thread ID, and anything else that can be seen in the columns.
There are also other visualization and minor capabilities which are less important.
Finishing up and Coming soon
This is it for this tutorial. We saw the fundamental must-know debugging tool windows that Visual Studio has to offer. There’s another tool window which I consider a fundamental one, and that is the Exceptions window. This is a rather big subject, which is covered in the next part of the tutorial.