Debugging a .NET program after crash (Post-mortem debugging)
In my previous company, we experienced a reoccurring nightmare. It went something like this:
New critical bug arrived from QA:
Program suddenly crashed. Reproduces 1 / 10 times. Reproduce steps – unclear.
The development team, after realizing they are unable to reproduce the bug on their development machine would claim the bug doesn’t reproduce, moving the ticket back to QA.
In return, the QA team reproduced the bug, moving the ticket back to dev.
Then, the development team would claim another layer of the code caused the bug, moving the ticket to a second development team maintaining that code.
The second development team, with spite, would find an obscure line of code in the log file proving the bug is actually not in their layer of code, moving the ticket to the original dev team.
This would go on until either the development team succeeded in moving the bug to backlog or, in rare cases and by sheer luck, the development team was able to solve the bug.
In our defense, all the coders who originally built the system were long gone, the application was huge and complicated.
I guess not much of an excuse but eventually we learned some tricks to help us solve those pesky crash bugs.
Well, some developers learned. Others kept claiming the bug doesn’t reproduce 🙂
Introducing our bag of tricks:
1. See the call stack with Exception details in Windows event viewer
Let’s build a small program that crashes. We’ll make it a simple .NET Console Application.
static void Main(string[] args)
{

    int cheque = CalculateRandomFraction();
    Console.WriteLine(cheque);
}

private static int CalculateRandomFraction()
{
    var rand = new Random();
    int num1 = rand.Next();
    int num2 = rand.Next();//Let's say we got 0 here
    return Fraction(num1, num2);
}

private static int Fraction(int num1, int num2)
{
    return num1 / num2;
}
Running this with num2 being 0 will crash the program with DivideByZeroException.
Let’s see how we find that out using Windows` Event Viewer.
First, we need to run the crashing program.
After out program crashed, we can go to the Event Viewer. Simply press the Win key and type event viewer. It will appear in the search.
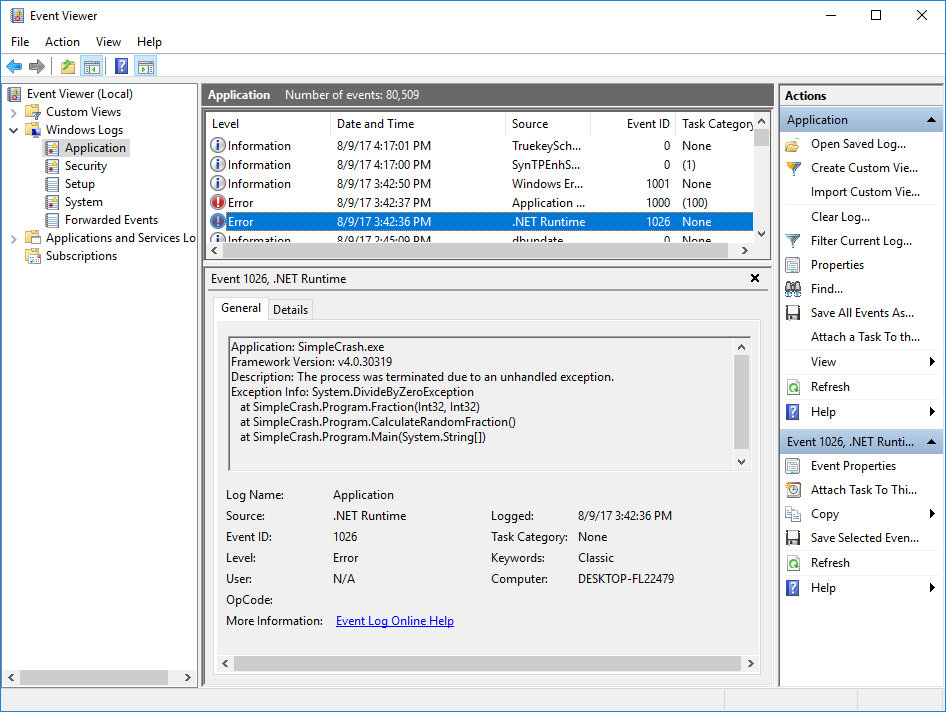
We need to go to Windows Logs -> Applications. Wait a few seconds and find the relevant crash.
Zooming in a bit:
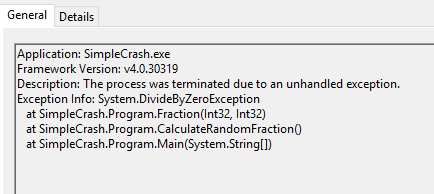
There you go, the call stack and the exception details that crashed our program.
Right clicking on the event will conveniently let you save it in .evtx format, which conveniently can be attached to the bug’s ticket and later opened by the developer.
This priceless call stack and exception details can give enough information to solve the bug. Or alternatively allow dev to add logs in the right places (for more information next time it reproduces).
Let’s go on to trick #2.
2. Logging exceptions that crashed our program
Which exceptions crash our program? The unhandled ones of course.
.NET allows us to catch an unhandled exception for enough time to log useful information before it terminates. (msdn documentation )
static void Main(string[] args)
{
    AppDomain currentDomain = AppDomain.CurrentDomain;
    currentDomain.UnhandledException +=
        new UnhandledExceptionEventHandler(OnUnhandledException);

    int cheque = CalculateRandomFraction();
    Console.WriteLine(cheque);
}

private static void OnUnhandledException(
    object sender, UnhandledExceptionEventArgs e)
{
    string exceptionStr = e.ExceptionObject.ToString();
    //Should be Logger.LogFatal(exceptionStr);
    Debug.WriteLine(exceptionStr);
}

private static int CalculateRandomFraction()
{
    var rand = new Random();
    int num1 = rand.Next();
    int num2 = 0;// rand.Next();//got 0
    return Fraction(num1, num2);
}

private static int Fraction(int num1, int num2)
{
    return num1 / num2;
}
By adding this code, our unhandled exceptions will always be logged and we don’t need the event viewer to view the call stack and exception type any more.
3. What about Dumps?
When all else fails, we have a last resort – the almighty Dump.
EDIT: For a full guide on using Crash Dumps, I suggest reading How to Create, Use, and Debug .NET application Crash Dumps in 2019
Analyzing dumps has a somewhat bad reputation. Nasty words like WinDbg are used and most people avoid it like the plague.
We actually don’t have to use WinDbg. Visual Studio allows us to open a dump file and view it as if we’re on a breakpoint at the moment of the crash.
Let’s see how it works.
First of all, we need to create a Dump automatically on crash.
Creating dump files on crash
There are several ways we can do it easily.
- Windows by default creates .dmp files automatically on crash. These will go to the folder %localappdata%\CrashDumps.
You can change the dump file folder by editing the registry (see the documentation and an example ) - Use ProcDump
command line tool.
For example. installing ProcDump and using this command line (from this blog post )
Procdump -e –mp store.exe –n 3 –accepteula d:\dumps\store_issue.dmp
Will start monitoring store.exe and create 3 dump files on crash. - According to this blog post , DebugDiag achieves the same (never used it myself).
Analyzing the .dmp file
The classic tool to analyze dumps is WinDbg , but it’s pretty difficult, and nowadays we can open the dump file with Visual Studio and visually see everything we need.
Let’s open with VS the SimpleCrash.dmp file created after crashing the example program on top. Here’s what we see:
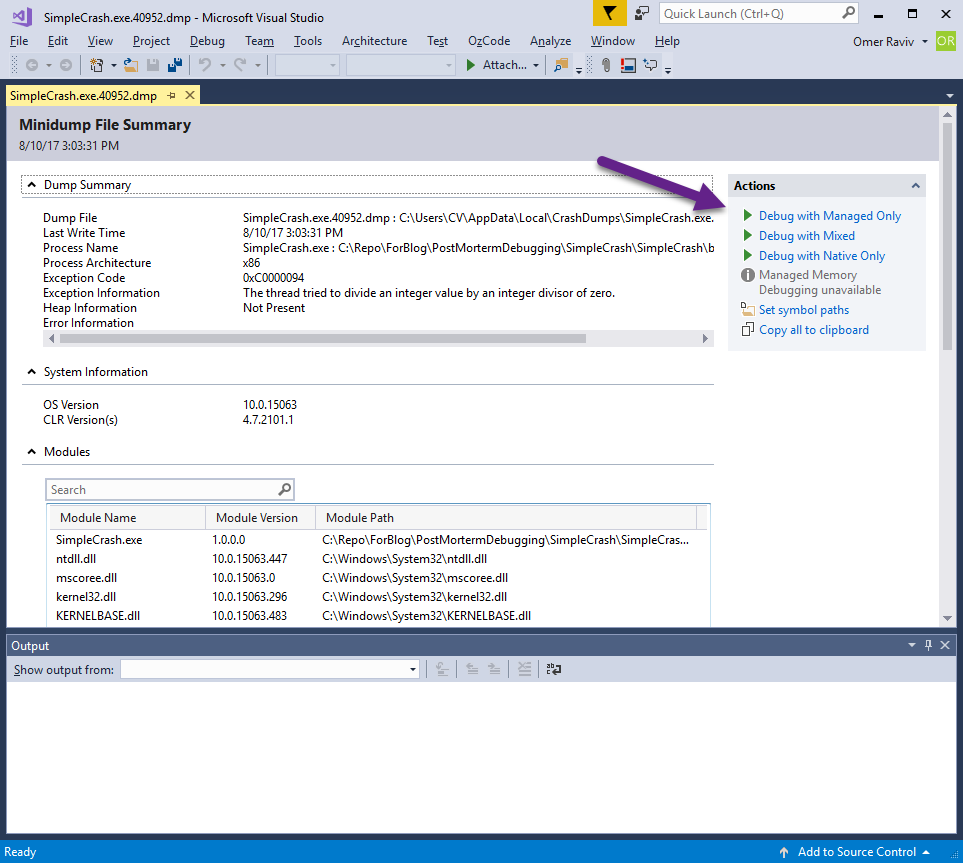
We have only managed code, so we need to press “Debug with Managed Only”.
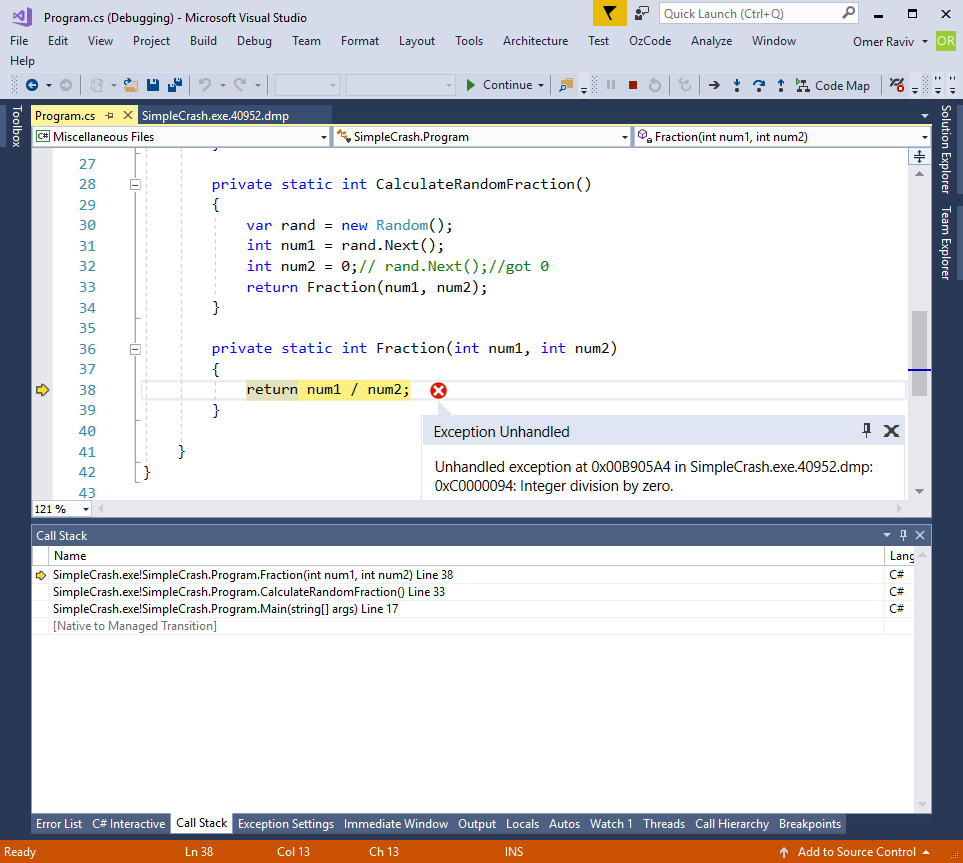
This magically brings us to the line of code causing the exception.
We can also view Threads, Call Stack, Locals, hover with mouse over variables… Basically, a complete debugging experience.
Note that this magic is possible because I have the symbols (.pdb files) on my machine. Which means Visual Studio can show the source code.
If I delete the .pdb files, we won’t see the source code but we will see the call stack with method names.
This means it stands to reason to keep the .pdb files with each version shipped to QA and the customer.
When a .pdb file is received from QA (or a customer), I can place it in my Release directory with the same exact compiled version and open it from there. Visual Studio will know to load the correct symbols.
Dumps are also great during Hang
During debugging session, when our program hangs (freezes), we can easily hit the Pause button in VS and explore the threads to find the problem.
In case our program hangs in a production environment, we can achieve the same result with dump files.
First, we need to create dump file of the hanging process.
Then, we can open the dump file in VS like during crash.
There are many ways to create the dump file during Hang.
- ProcDump command can create a dump file automatically during hang, as shown on top.
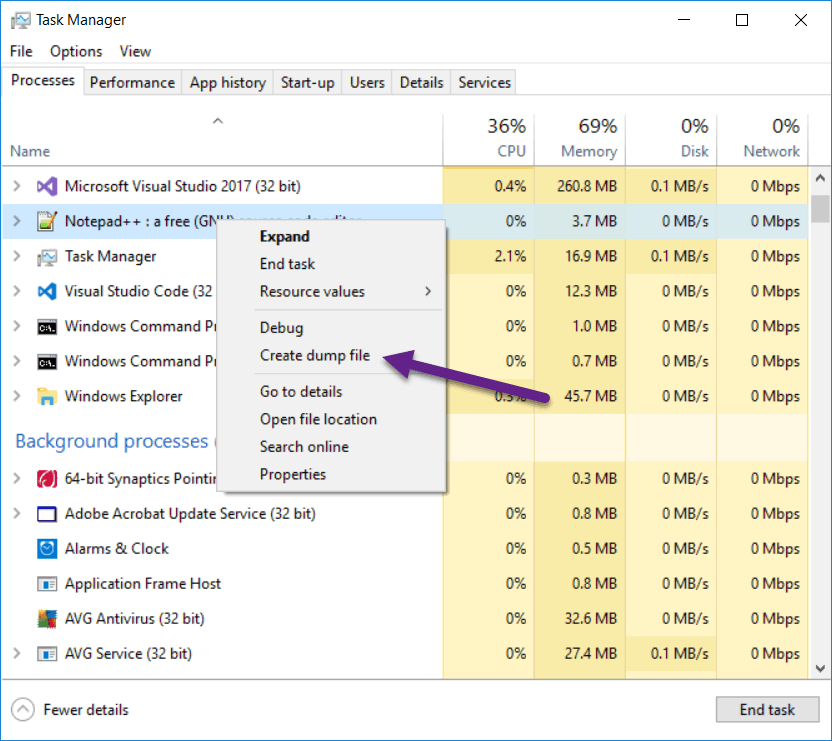
- We can create a dump file from Task Manager by right clicking the process and selecting Create dump file.
Summary
We saw some tricks that can show the call stack, exception details and application state during the crash. A lot of the times this is just the beginning to solving the bug, since we will need to figure out how we got to that faulty state.
If this bug reproduces only rarely in production environment, you might want to start adding new prints to the log file to better understand the problem. For me, staring at the code for awhile and running the different scenarios in my head usually works.