Debugging 3rd Party .NET Code without symbols in Visual Studio

It’s not so rare to see weird things happen in 3rd party library code. Call some method and you’ve got a strange exception. Or an incorrect behavior or even a process crash. Is it a bug? Are you doing something wrong? Is it a configuration problem? It sure would be nice to debug some of these issues.
In this article we’re going to do just that – We’re going to see how to debug 3rd party library code in Visual Studio. It doesn’t have to be 3rd party code though. It might be internal company code without symbols, your own production code, or code from the .NET framework itself. We’ll see how to debug any .NET assembly that has no symbols or source code.
Breaking on Exceptions from 3rd-party code
There are many cases when there’s an exception in the 3rd-party code that you want to debug. Here are some examples:
- When something strange is going on and you can’t understand why. For example, a request to your server returns a 500 error code for no apparent reason. There’s a good chance there was an exception in some middleware for which you don’t have symbols and source code. The exception was swallowed in a
catchclause and you are left to guesswork. - It happens once and again that you’re calling 3rd party library code and it returns unexpected results. There’s a good chance an exception was thrown and then handled. If you knew the exception details, it might have helped to solve the issue.
- Suppose you’re calling 3rd party library code and it throws an exception. You will see the exception object, but only partial call stack frames. And no local variables from the frame where the exception was thrown. Sure, the exception object contains some of the details, but that’s not the whole picture.
There are a couple of things you need to do to be able to debug these exceptions.
1. User Code and non-user code
Visual Studio tags code as “user-code” and “non-user code”. If an assembly has symbols and it’s not optimized, then it’s considered “user-code”. Otherwise, it’s considered “non-user code”. Any 3rd-party code is going to be “non-user code” because it’s usually without symbols and almost certainly optimized.
To break on exceptions from non-user code, you’ll need to turn off the “Enable Just My Code” setting in VS options:
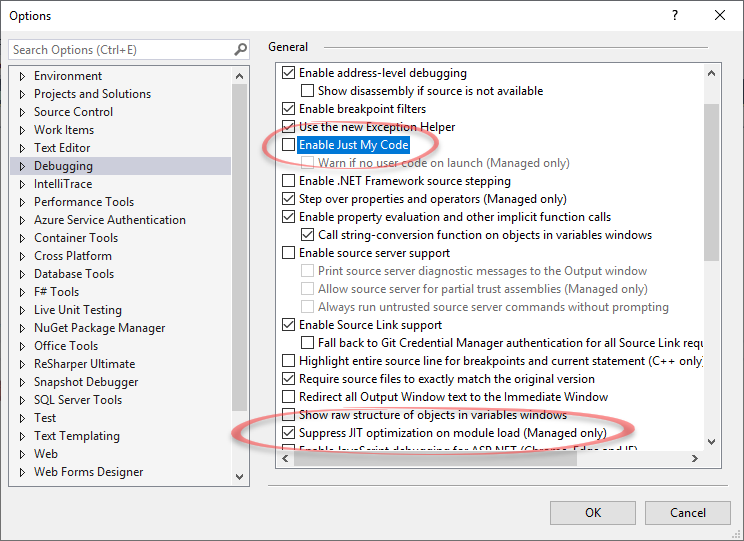
2. Optimized code
When you build a project in “Release” mode, it’s set to “optimize code” by default. This is done for performance reasons because optimized code is much faster. Code optimization changes many things like rearranges code and inlines methods. For performance reasons and to prevent reverse-engineering, 3rd party code is almost always optimized.
When you build in “Debug” mode, the default setting is not to optimize code. That’s because when code is optimized, many of the debugger’s features stop working. This includes seeing Local Variables, seeing the currently executed line and stopping on breakpoints.
The thing is that the IL code produced from Debug and Release builds is the same because code optimization is done in runtime. The only difference is a flag that instructs the JIT compiler to optimize or not to optimize. By default, when you do break on the exception, you won’t see Locals because the code will be optimized. But if you check “Suppress JIT optimization on module load” (like in the image above), then VS will tell the JIT Compiler, not to optimized code.
Note that code is optimized when a module loads. So if you attach Visual Studio when the module was already loaded, it will stay optimized, even if the “Suppress… ” setting is on. That’s why it’s always best to start the process with Visual Studio debugger instead of attaching. You can see which modules are optimized in the Modules window.
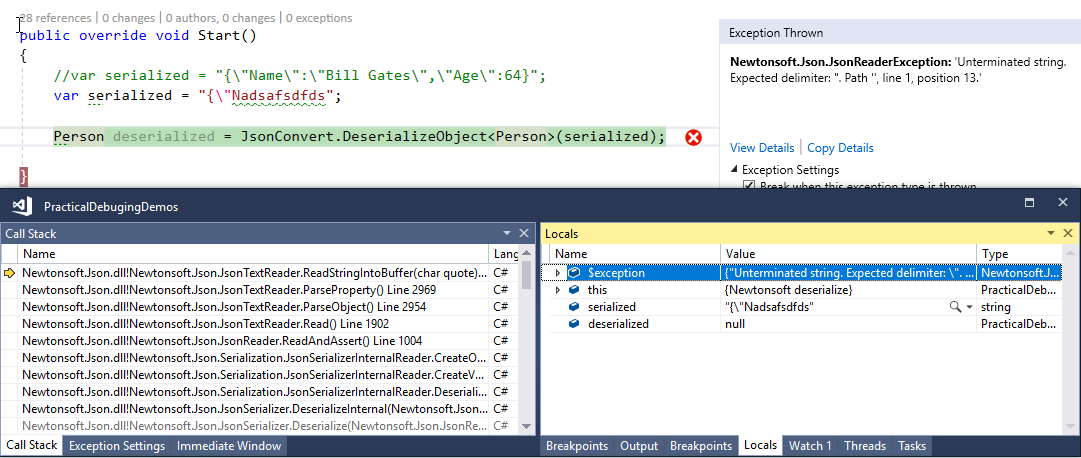
Here’s an example of an exception in 3rd-party code:
public override void Start()
{
    var serialized = "{\"Nadsafsdfds";
    Person deserialized = JsonConvert.DeserializeObject<Person>(serialized);
}
When checking “Suppress JIT optimization” you’ll see Locals and you’ll see a full call stack:
However, if “Suppress JIT optimization” was not checked and the code was optimized, the results are much less informative:
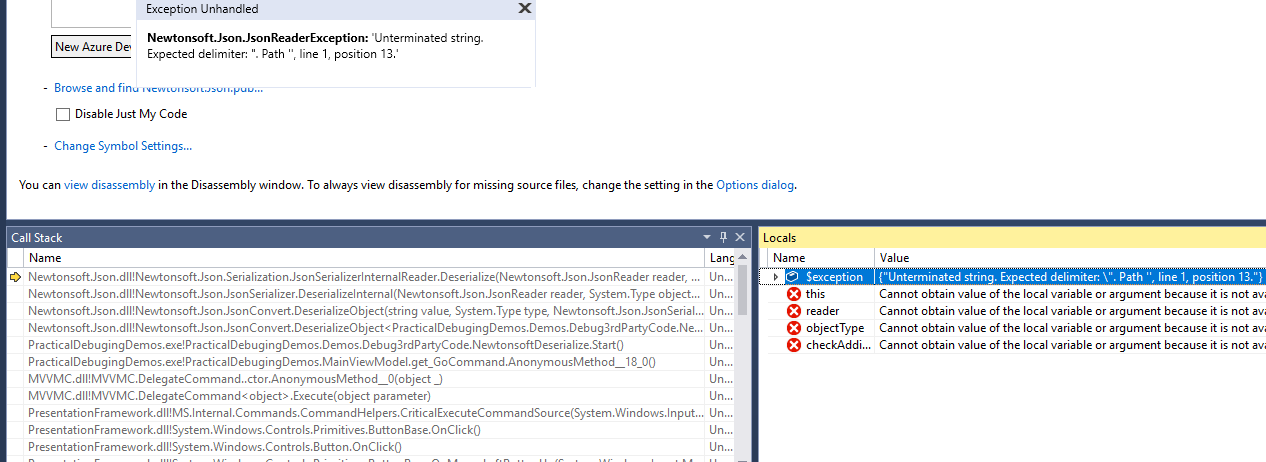
The Locals cannot be evaluated and the call stack doesn’t really say anything from within the non-user code.
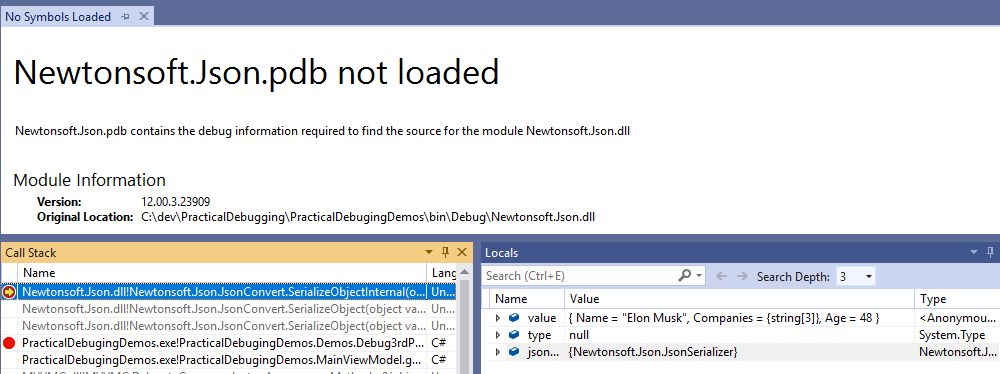
Newtonsoft.Json has SourceLink enabled . This means the symbols contain a link to the correct git commit with the source code. If adding with NuGet, Visual Studio will be able to automatically load the source code and everything will work by itself. Instead of adding a NuGet package, I deleted the symbols and manually referenced Newtonsoft.Json.dll. So we’re now dealing with an assembly without symbols or source code.
Place Breakpoints anywhere
It’s possible to place breakpoints in Visual Studio into methods for which you don’t have the source code.
Before starting, make sure to uncheck “Enable Just My Code”, otherwise the breakpoint won’t be hit. And to check “Suppress JIT optimization on module load” so that you can see Locals when the breakpoint does hit.
Before placing the breakpoint in 3rd party code, you’ll need to find the method where you want to place the breakpoint. To do that, use your favorite decompiler to open the assembly and explore the methods (like ILSpy
, dotPeek
, or JustDecompile
). In the case of Newtonosoft.Json, let’s say I want to place a breakpoint in the private method SerializeObjectInternal. You’ll need the fully qualified name here: Newtonsoft.Json.JsonConvert.SerializeObjectInternal where Newtonsoft.Json is the namespace, JsonConvert is the class name, and SerializeObjectInternal is the method.
Now go to Debug | Windows | Breakpoints and click on New | Function Breakpoint…
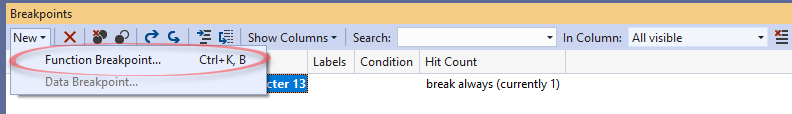
In the dialog that opens, enter the fully-qualified name: Newtonsoft.Json.JsonConvert.SerializeObjectInternal.
That’s it, run the code and the breakpoint will be hit.
You’ll be able to see the full call stack and the Locals. Pretty nice for no symbols and no source code. You can travel in the call stack and other threads. You’ll see Locals for all frames, including those without symbols.
Note that VS has a little quirk when placing these breakpoints. It doesn’t seem to work if you place the breakpoint before the current debugging session. So if you restart the process and start debugging again, your previously set breakpoints won’t work. You always have to start debugging and set new breakpoints in the current debugging session.
TIP: Sometimes, you want to debug 3rd-party code, but have no idea which methods are hit and where to place the breakpoint. A great way to find out which methods were invoked in a scenario is to use a performance profiler like dotTrace . Record the snapshot you want to debug and look at all the methods that were called. It’s best to use Tracing mode, which shows all methods that were hit, even if they took very little time.
Full debugging experience with dotPeek’s symbol server
Placing breakpoints is nice and can get you somewhere, but there’s nothing like a full debugging experience where you can step over code with F10, step into methods with F11, and watch variables. It’s quite possible to do in Visual Studio with any managed assembly, even without symbols and source code.
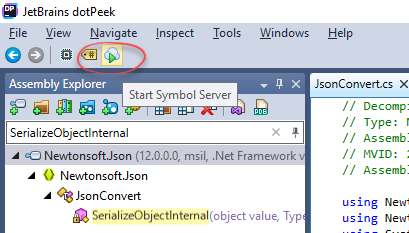
Even though this experience is a bit nicer with dnSpy , you can achieve the same with Visual Studio and dotPeek’s Symbol Server capability. The concept is pretty simple: dotPeek decompiles the assembly and extracts symbols that point to the decompiled code. It then acts as a symbol server. Visual Studio just needs to add the symbol server’s location and debugging just works.
To do this, start dotPeek with the correct bitness – dotPeek32.exe if you’re debugging a 32-bit process and dotPeek64.exe if you’re debugging a 64-bit process. Open the assembly that you want to debug in dotPeek with File | Open. You’ll see it appear in the Assembly Explorer. Now click the “Start symbol server” button:
dotPeek will tell you the server’s location. Something like http://localhost:33417.
In Visual Studio, go to Tools | Options | Debugging | Symbols. Hit the New Location button on top and add the URL from dotPeek. Now you’re all set to start debugging. You’ll be able to step into (F11) the 3rd party library and debug freely with source code and all other VS features available:

Like with all other methods in this article, when using this, you need to disable the “Enable Just My Code” option and enable the “Suppress JIT optimization on module load” option.
If you don’t want to step into the 3rd-party library code with F11, and want to place a breakpoint instead, there are a couple of ways to do that:
Use the New Breakpoint functionality in Visual Studio’s Breakpoints window that we talked about before.
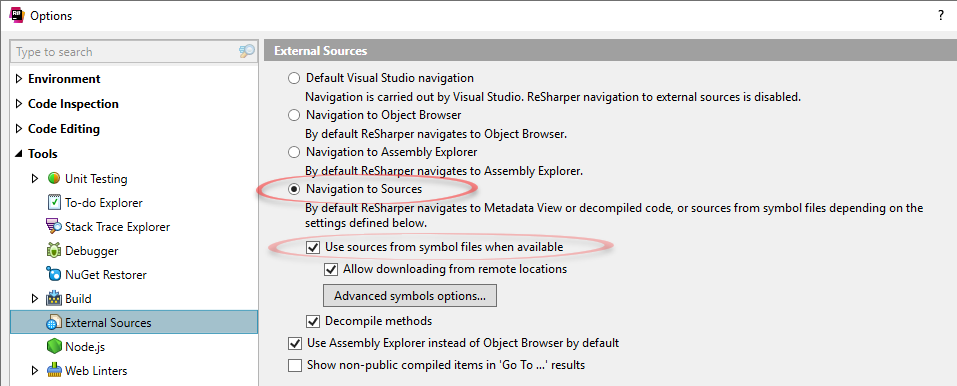
Use ReSharper’s Navigation to Sources feature. In this mode, R# overrides the default Visual Studio behavior when clicking F12 (Go to Definition). Instead of going to assembly Metadata, R# can take you to decompiled sources. And it integrates perfectly with dotPeek’s symbol server by preferring symbol server sources first. Go to Extensions | ReSharper | Options | Tools | External Sources and select the last option Navigation to Sources:
Now you can navigate to the library code with F12 and place breakpoints freely.
Full debugging experience with just ReSharper
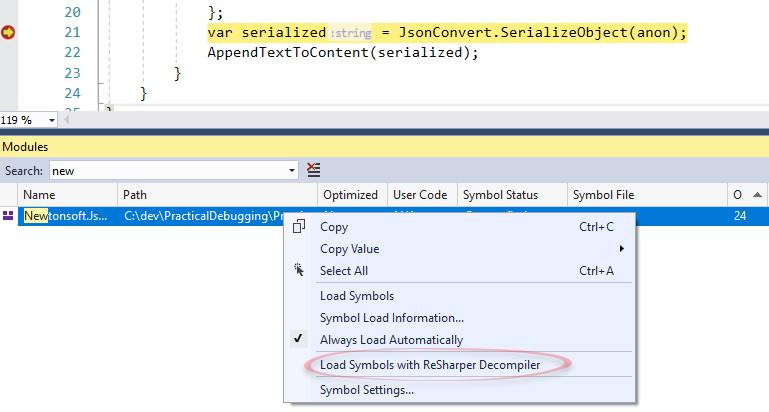
You can achieve a full debugging experience with nothing but ReSharper. That is, without dotPeek at all. The trick is to go to the Modules window after the module you want to debug was loaded, and select Load Symbols with ReSharper Decompiler.
 Now you’ll be able to step into code with F11, set breakpoints, etc. Like with the other techniques, remember to disable the “Enable Just My Code” option and enable the “Suppress JIT optimization on module load” option.
I experienced some quirks with this method that I didn’t have with dotPeek. For some files the decompiled souce code file was not found. When this happens VS presents a dialog asking for the location of that file. It did exist on the hard disk, R# decompiled it correctly. My workaround was to use Everything to find that file on disk and set the full path in the dialog. After this, everything continued to work well.
Thanks to Cezaty Piątek for introducing me to this method. He wrote a great blog post describing in detail on how to do this with just ReSharper
Summary
There are several techniques that we saw to debug .NET assemblies without symbols or source code. These methods can be a lifesaver when running into strange behavior. If there’s one thing to remember from this article, it’s this: Whenever something strange is going on, uncheck “Enable Just My Code” and run the scenario again. It’s very possible that some exception occurred and you didn’t even notice.
As for the wonderful experience with dotPeek’s symbol server – as great as it is, dnSpy is even better. And it’s much more suited to debug production machines than Visual Studio. Just copy the installation folder and run the executable. But that’s stuff for another blog post. Happy debugging.