OzCode Review and Black Friday 2019 Discount

You might have heard about OzCode before. It’s an extension for Visual Studio. Like ReSharper, but with very different functionality. The single purpose of OzCode is to help you debug code and find the root cause of problems. In this blog post, I’m going to tell you about some amazing features in OzCode from my perspective and why you should try it out.
Disclaimer – I am an OzCode employee. But this is my personal blog and opinions. OzCode is doing a Black Friday promotion and I thought it’s a good opportunity to tell about my favorite product. So let’s review the extension and I’ll share a sweet 50% discount coupon in the end.
What can OzCode do for you?
As I mentioned, OzCode is a Visual Studio extension. It supports just C# projects and it works exclusively during debugging. When you’re editing code, OzCode is pretty dormant.
OzCode is going to help you debug by doing debug data visualizations and analysis. One of the most valuable things it does is to replace the terrible DataTip that comes with Visual Studio (or tooltip as some of us call it). OzCode’s DataTip is like the default DataTip on steroids:
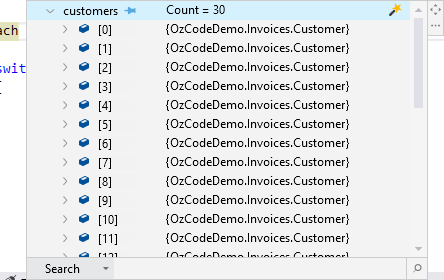
Looks regular, right? But it has some crazy features. Like a decent Search functionality. Yes, a search functionality – something I thought VS was missing from inception. It will go through any object’s field names and values several levels deeps in hierarchy. As many levels as you want actually. And it will do it extremely fast. I should know, I developed it.
Now check out how each of the items looks like: {OzCodeDemo.Invoices.Customer}. That’s the default .ToString() implementation of any class, which just shows the type. OzCode changes that with a very cool feature called Reveal:
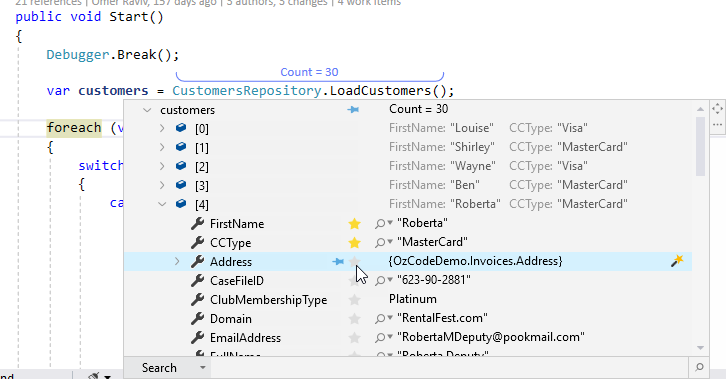
You can select which properties you’d like to see and OzCode just shows them. Now you can finally scroll through a collection during debugging and see something useful.
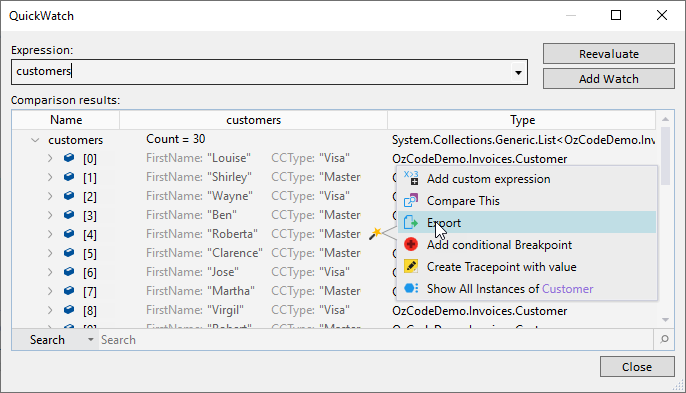
From here, you can use the Export feature to take any object or property and see it as JSON/XML/C#. First, select the property (or root) to export from the DataTip or QuickWatch window:
After clicking export, see the data as JSON, XML, or C# generated code:
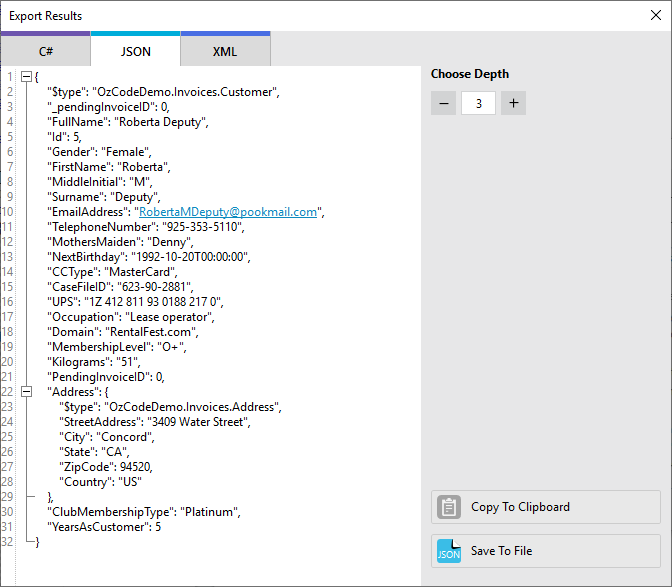
By the way, the export-to-C# feature is pretty cool for unit testing. It generates C# code that creates an object. You can copy-paste the code and use it to create input parameters for your tests.
The DataTip has more functionality, but let’s move on to another killer feature – LINQ debugging
LINQ Debugging With OzCode
LINQ is pretty awesome but notoriously hard to debug . You have to separate operators into separate expressions or place breakpoints inside lambda functions. Neither provides a very pleasant debugging experience. OzCode solves this problem for you.
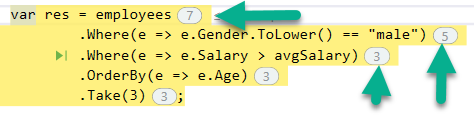
When you’re standing on a LINQ expression during debugging, you’ll see operation result count in little adornment bubbles:
From here you can click on a bubble to analyze how the LINQ worked:
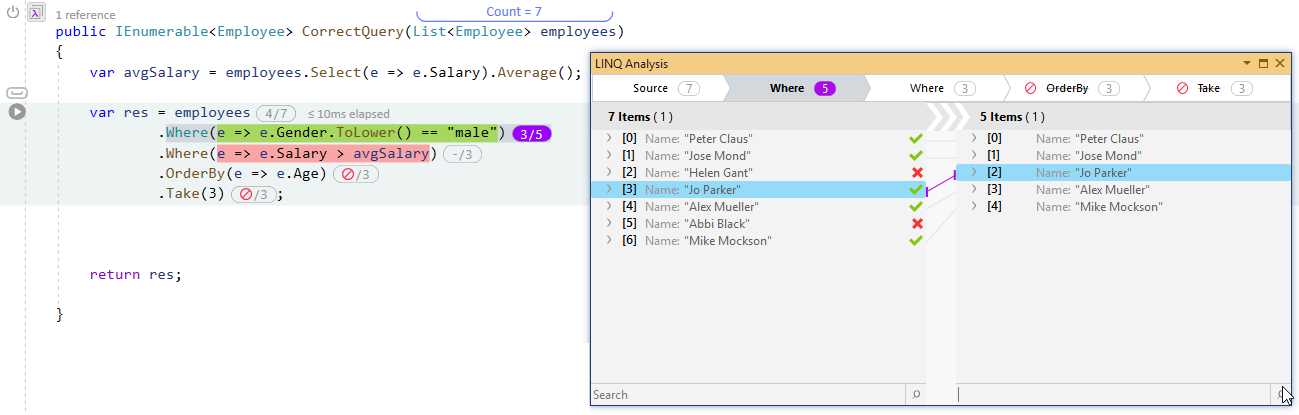
You can see each item before and after the operator (the operator in the image is Where for example). You can see if it was filtered out or not. If it’s an operator like Select, you’ll see how each item was transformed with the operation. You can also use the DataTip features in this window: Search and Reveal, which we talked about before.
Time Travel
The Time-Travel feature is probably the craziest feature of all. OzCode simulates the results of code execution in the future without actually running it. And it has all sorts of benefits as you’re about to see. This is best described with a picture:
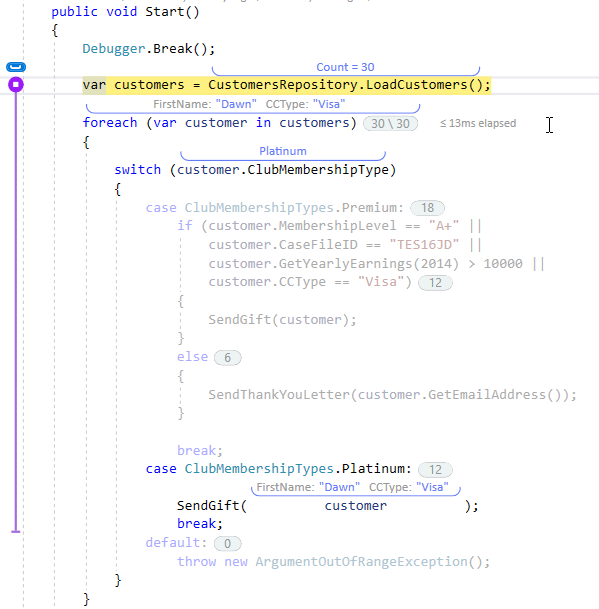
Note that the debugger’s yellow marker is on the 2nd line of the method. From there, OzCode simulated the rest of the method. You can see how many items go through each loop in the little bubbles. And how many items landed in the case statement in another bubble.
OzCode allows you to “select an iteration”. In the above image, the last iteration is selected in the foreach statement – 30/30. Now, all the values you see are relevant to that last iteration. If you look at the 4th line from the end, you can see the customer is “Dawn”. This is the last customer in the collection customers.
You can hover over any bubble and switch iterations to see what goes on inside in that point in time:
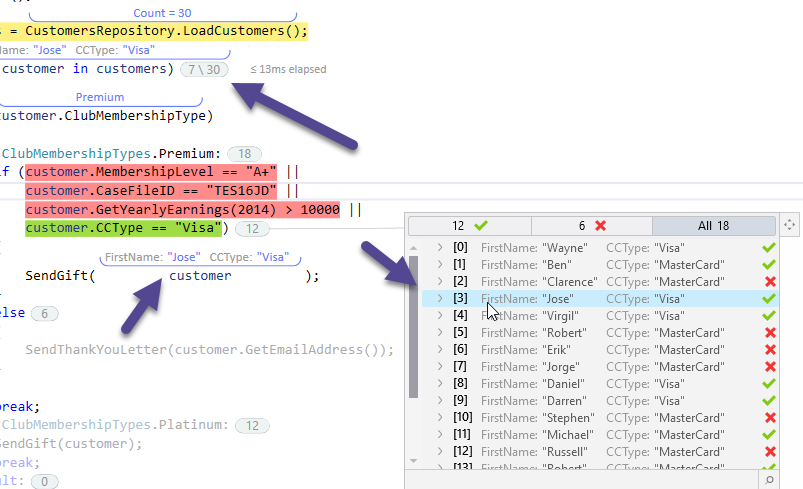
When you hover of the “if” bubble, you’ll be able to see all the loop items and which items returned “true” for this specific “if” condition. From there, you can investigate what happened in that specific iteration.
So the time travel features save you the trouble of re-running a scenario multiple times during debugging and “catching” just the right moment where something bad happens. With OzCode you don’t have to leave the breakpoint.
Time travel doesn’t work in all cases. For example, suppose your code goes to a database. We can’t simulate that kind of action without actually calling the database, which means the debugging affects the application state. So we don’t. Whenever there’s anything OzCode can’t simulate without side effects, it stops time-travel at that point. This includes all native code as well.
More Features and a Black Friday Discount
I highlighted my own favorite features, but OzCode has a bunch more :
- Tracepoints – Have your breakpoints print messages and variables to a dedicated window
- Export to Excel – Exports collection to an excel file
- Compare – Compares objects in a side-by-side view. Kind of like beyond-compare or K-Diff.
- Heads up Display
- Exception Trail and Exception Predict
- Show all Instances – Shows all instances of a specific type
You can easily try it out, there’s a free trial for 14 days. If you decide to buy, use the coupon code BlackFriday19MichaelS to get a 50% discount (personal only). Buy now from this link . Note that this coupon is only valid up to December 4th. Happy debugging!