LINQ is one of my favorite features in C#. It just makes the code look nicer. Instead of tedious foreach loops, we got a neat functional syntax that’s easy to write and understand. Well, at least if we’re using the method syntax
flavor of LINQ.
LINQ is also terrible to debug. We have no way of knowing what goes on inside that query. We can see the input, we can see the output, but that’s about it. What happens when something goes wrong? Do we just stare at the code, trying to get some kind of insight? There’s got to be a better way…
I wrote this post originally in 2019, but after migrating from WordPress to Hugo , it somehow disappeared. Thanks to the incredible Wayback Machine , I was able to fully restore it.
Debugging LINQ
While difficult, it is possible to utilize a few techniques to debug LINQ.
First, let’s create a little scenario. Suppose we want a list of 3 male employees with bigger than average salary, ordered by age. That’s a pretty common type of query, right? Here’s the code I’ve written for that:
public IEnumerable<Employee> MyQuery(List<Employee> employees)
{
    var avgSalary = employees.Select(e=>e.Salary).Average();
    return employees
        .Where(e => e.Gender == "Male")
        .Take(3)
        .Where(e => e.Salary > avgSalary)
        .OrderBy(e => e.Age);
}
And the data set is:
| Name | Age | Gender | Salary |
|---|---|---|---|
| Peter Claus | 40 | “Male” | 61000 |
| Jose Mond | 35 | “male” | 62000 |
| Helen Gant | 38 | “Female” | 38000 |
| Jo Parker | 42 | “Male” | 52000 |
| Alex Mueller | 22 | “Male” | 39000 |
| Abbi Black | 53 | “female” | 56000 |
| Mike Mockson | 51 | “Male” | 82000 |
When running this query, I get the result Peter Claus, 61000, 40.
That doesn’t seem right… There should be 3 employees. And the average salary is about 56400, so the result should include “Jose Mond” with 62000 salary and “Micki Mockson” with 82000.
So I have a bug in my LINQ query, what to do? Well, I can stare at the code until I figure it out, which might even work in this particular case. Or, I can debug it somehow. Let’s see how we can debug it.
1. Evaluate parts of the query in QuickWatch
One of the easier things you can do is to evaluate parts of the query in the QuickWatch window . You might start with the first operation, then go on to the 1st + 2nd operations and so on.
Here’s an example:

You can use OzCode’s reveal functionality to display just the fields you’re interested in, which makes it easy to find the problem.
We can see that even after the first query, something is wrong. “Jose Mond”, supposedly a male, seems to be missing. Now, I can stare at a much smaller piece of code to figure out the bug. Yup, I think I got it – Jose’s gender is written as “male”, not “Male”.
I can do a small fix to the query now:
var res = employees
        .Where(e => e.Gender.Equals("Male", StringComparison.OrdinalIgnoreCase))
        .Take(3)
        .Where(e => e.Salary > avgSalary)
        .OrderBy(e => e.Age);
Which results in the output:
Jose Mond, 62000, 35
Peter Claus, 61000, 40
Jose is now included, so the first bug is fixed. There’s another bug though, “Mike Mockson” is still missing. We’ll solve with the next technique.
This technique has its drawbacks. If you need to find a specific item in a big collection, you might have to spend a lot of time in the QuickWatch window.
Also note that some queries can change the application state. For example, you might call a method inside a lambda function that can change an instant. Something like var res = source.Select(x => x.Age++). By running this in the QuickWatch, you will change application state and compromise the debugging session. This can be avoided by adding the , nse no-side-effects postfix
to the expression. To use it, first copy the expression to the clipboard, open an empty QuickWatch window, and manually paste the expression with the , nse postfix.

2. Place breakpoints in the lambda expressions
Another great way to debug LINQ is to place a breakpoint inside lambda expressions. That allows evaluating individual items. For big collections, you can combine this with the Conditional Breakpoints feature.
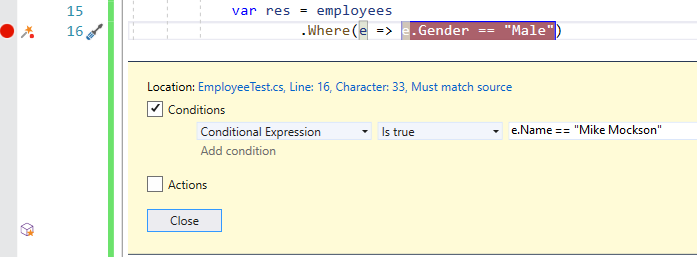
In our case, we found out that “Mike Mockson” wasn’t part of the first Where operation’s result. You can place a conditional breakpoint in the lambda expression in .Where(e => e.Gender == "Male") with the condition e.Name=="Mike Mockson".

In our case, that breakpoint will never be hit. After fixing the predicate to .Where(e => e.Gender.Equals("Male", StringComparison.OrdinalIgnoreCase)), it still won’t be hit. Can you guess why?
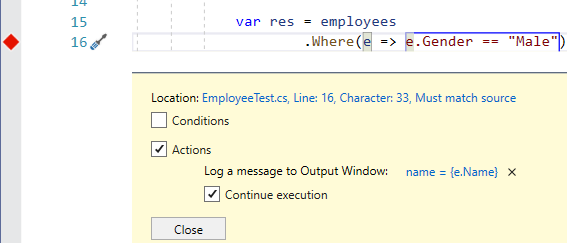
Instead of staring at the code, we can use the Actions feature of breakpoints, which allows to log stuff to the output window whenever the breakpoint is hit.

After running the query, we will see this:

Only 3 names were printed. That’s because we have .Take(3) in our query, which stops evaluating after the first 3 matches.
We did want a list of 3 male employees with bigger than average salary, ordered by age. So we probably should use Take operator only after checking for salary. This will change the query to the following:
var res = employees
        .Where(e => e.Gender.Equals("Male", StringComparison.OrdinalIgnoreCase))
        .Where(e => e.Salary > avgSalary)
        .Take(3)
        .OrderBy(e => e.Age);
Which correctly results in Jose Mond, Peter Claus, and Mike Mockson.
In LINQ to SQL, this technique will not work
3. Use a log-middleware method
Let’s revert to the initial state where the bug is not yet fixed, and we are dumbfounded in face of the seemingly correct query.
Another way to debug queries is with the following extension method:
public static IEnumerable<T> LogLINQ<T>(this IEnumerable<T> enumerable, string logName, Func<T, string> printMethod)
{
#if DEBUG
    int count = 0;
    foreach (var item in enumerable)
    {
        if (printMethod != null)
        {
            Debug.WriteLine($"{logName}|item {count} = {printMethod(item)}");
        }
        count++;
        yield return item;
    }
    Debug.WriteLine($"{logName}|count = {count}");
#else
    return enumerable;
#endif
}
And here’s how you can use it:
var res = employees
        .LogLINQ("source", e=>e.Name)
        .Where(e => e.Gender == "Male")
        .LogLINQ("logWhere", e=>e.Name)
        .Take(3)
        .LogLINQ("logTake", e=>e.Name)
        .Where(e => e.Salary > avgSalary)
        .LogLINQ("logWhere2", e=>e.Name)
        .OrderBy(e => e.Age);
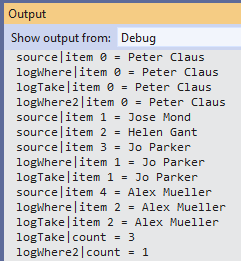
The output is:

Instructions and explanation:
- Place the
LogLINQmethod after each operation in your LINQ query. It will optionally print all the items that passed this operation and the total count. - The
logNameis a prefix to each output, to easily see the query step where it was written. I like to name it the same as the operation name it’s after. - The
Func<T, string> printMethodallows to print whatever you want given the item. In the above example, I chose to print the employee’s name withe=>e.Name. Whennull, nothing will be printed except for total count. - For optimization, this method works only in debug mode. (
#if DEBUG). In release mode, it will do nothing. - Each item was printed in order, without waiting for the operation to end. That’s because of the lazy nature of LINQ. Here’s a tip to see results of a single operation: Copy the entire output to notepad++
. Then, use Ctrl+Shift+F (Find) and look for the log-name prefix (for example
logWhere2). In the “Find” dialog, click Find All in Current Document. This will show just the lines that matched the log-name prefix.
Looking at the output window, you can see a couple of things:
- The
sourceincludes “Jose Mond”, butlogWheredoesn’t. This is the case-sensitivity bug we saw before. - “Mike Mockson” is never evaluated even in source due to the early
Takemethod. In fact,source‘s count log is missing entirely because it never got to the end of the collection.
This technique is problematic for LINQ to SQL, and possibly with other LINQ providers. It will transform an IQueryable to an IEnumerable, changing the query and forcing early evaluation. Best use it only for in-memory collections and not with LINQ providers (like Entity Framework).
4. Use OzCode’s LINQ feature
If you need a power tool to debug LINQ, you can use the OzCode Visual Studio extension.
Disclaimer: At the time of writing this, I was an OzCode employee. Since leaving in 2020, OzCode joined DataDog and I didn’t follow their support for newer Visual Studio and C# versions.
OzCode will visualize your LINQ query to show exactly how each item behaved. First, it will show the number of items after each operation:

Then, you can click on any numbered button to see the items, and their progress through the operations

We can see that “Jo Parker” was 4th in the source, then 3rd after the first Where operation. He didn’t pass the 2nd Where and he wasn’t even processed in the last 2 operations OrderBy and Take.
If that’s not enough, you can press on the “lambda” button in the top-right corner to see a full LINQ analysis. Here’s how it looks:

So pretty much all you can hope and dream for in terms of debugging LINQ.
Summary
Debugging LINQ is not very intuitive, but it can be sanely done with some techniques.
I didn’t mention LINQ query syntax because it’s not used as much. Only technique #2 (breakpoint in lambdas) and technique #4 (OzCode) will work with query syntax.
LINQ works for both in-memory collections and for data sources. These can be SQL databases, XML schemas, and web services. Not all of the above techniques will work with data sources. In particular, technique #2 (breakpoint in lambdas) won’t work at all. Technique #3 (log-middleware) might work for debugging, but it’s best avoided because it changes the collection from IQueryable to IEnumerable. Never leave the LogLINQ method in production for data sources. Technique #4 (OzCode) will work well for most LINQ providers but might have some subtle changes if the LINQ provider works in a non-standard way.
I hope you’ll use some of the tips from this article. Stay tuned for future posts. Cheers.


