You’re sending an HTTP request to your ASP.NET server, and out of the blue, it returns a 500 error. Now what? The error code doesn’t say too much by itself. Did a database request fail? What was the exact database query? Was there an exception? What kind of exception? On which line of code did it happen? And what were the local variables? Wouldn’t it be great if you could see the failure as if you’re breaking on an exception while debugging in Visual Studio?
In this article, we’re going to see how to get the most information about the failed request. This includes the error code, the type of failure, the method where the exception occurred, the exception type, exception stack trace, local variables, and the exact line of code where the exception happened. Not all failed requests are caused by an exception in code, but 500 errors do. We’ll focus mostly on failures caused by exceptions.
Table of Contents:
- Web request error example
- Dealing with failures in Azure App Service vs a Machine with IIS
- Using Fiddler and Postman to debug
- Use development exception pages to see the exception
- Middleware to capture request failures
- See Failures in native ASP.NET logs
- Use Error Monitoring tools like Raygun and Application Insights
- Break on exceptions with Cloud Explorer
- Use Microsoft’s Snapshot Collector
- Capture Dumps with ProcDump
- OzCode’s Production Debugger
- Summary
Web Request Error Example
Let’s say you’re building a simple ASP.NET Web API application and you’ve got the following controller:
public class CalculatorController : Controller
{
    [HttpGet]
    public int Divide(int a, int b)
    {
        var result = DivideInternal(a, b);
        return result;
    }

    private int DivideInternal(int a, int b)
    {
        return a/ b;
    }
}
When you call GET https://localhost:5000/Calculator/Divide?a=6&b=2 you’ll get the result 3. Makes sense. But what happens when you call GET https://localhost:5000/Calculator/Divide?a=8&b=0? In this case, a DivideByZeroException will be thrown and the server will return a 500 error.
In this simple case, it’s obvious what happened. But usually, you’ll need to investigate and find the root cause of the problem. This article will show many techniques to get the most information from the failure and find the core issue.
Dealing with failures in Azure App Service vs a Machine with IIS
In Azure, there are 2 ways to deploy an ASP.NET application: On a Virtual Machine with IIS or on an Azure App Service. In AWS, or another cloud provider, a virtual machine is the only option.
An App Service is a managed virtual machine. That means Azure takes care of everything: OS updates, security issues, environment settings, SDK updates, and so on. The tradeoff is that you’re much less flexible. A dedicated virtual machine means you can do whatever you want. If you want to run a Mongo DB database instance, you can. If you want to run a PHP server, not a problem.
The big difference for us is the ability to run IIS Manager (InetMgr) and to Remote-Desktop (RDP) to the machine. With an Azure App Service, you can’t do either. There was an option to install an InetMgr client and connect remotely . But it’s not supported anymore after App Services moved to Windows Server 2016.
You have more options in a virtual machine, but that doesn’t mean an App Service can’t be debugged. We have quite a lot of methods to detect and investigate failures in an App Service as well, as you’re about to see.
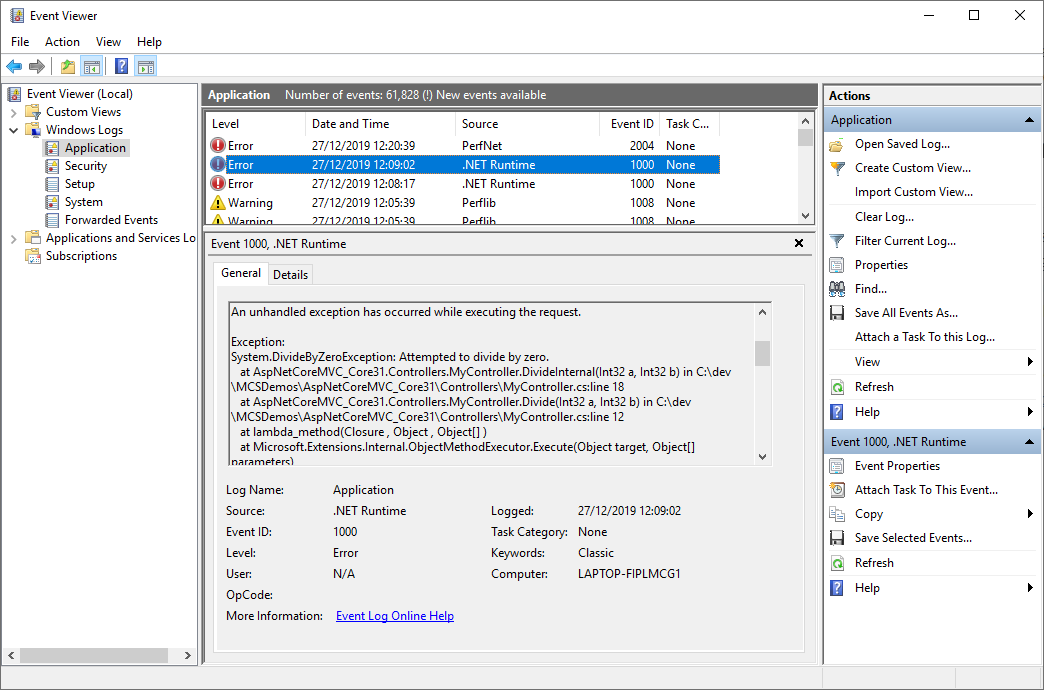
One useful feature of having the ability to RDP to a virtual machine is the ability to run Windows Event Viewer. Windows has a built-in logging system called Windows Event Log. Whenever there’s a failed request, it’s logged automatically. To inspect it, open Event Viewer by typing “Event Viewer” in the start menu or using the command eventvwr from the command prompt. Here’s how you’ll see the DivideByZeroException error from before:
Using Fiddler and Postman to debug
Before diving deep into various techniques to get failure details, let’s talk about a couple of useful tools to debug web requests. One of them is Fiddler and the other one is Postman .
Fiddler allows you to monitor all HTTP requests on a machine. You can see the request URL, headers, query parameters, body, and so on. You can also replay requests and manipulate them. This is very useful to debug and reproduce request errors. Instead of re-running whatever scenario you need to send the same request, if it’s even possible, you can just replay it with Fiddler. This gives you the time to set up debugging tools on the server. Or to check that the bug no longer reproduces after you’ve applied some fix.
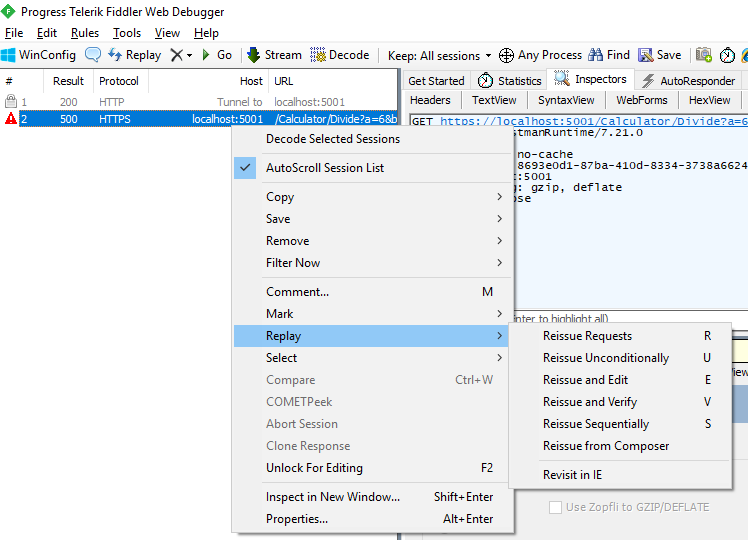
Postman is a very popular tool to send HTTP requests and inspect the result. It has a ton of features, like test automation, import/export, collaboration, and others. What you can do is to copy the request from Fiddler and paste to Postman. Now, save it to your Postman session and debug from there. Sending from Postman is much more convenient than Fiddler’s Replay feature. You can create collaborative workspaces, and share your Postman sessions with other team members. And you can automate it and convert requests to tests.
Use Developer Exception pages to see the exception
ASP.NET can show a special Developer Exception Page when a request fails. It looks like this:
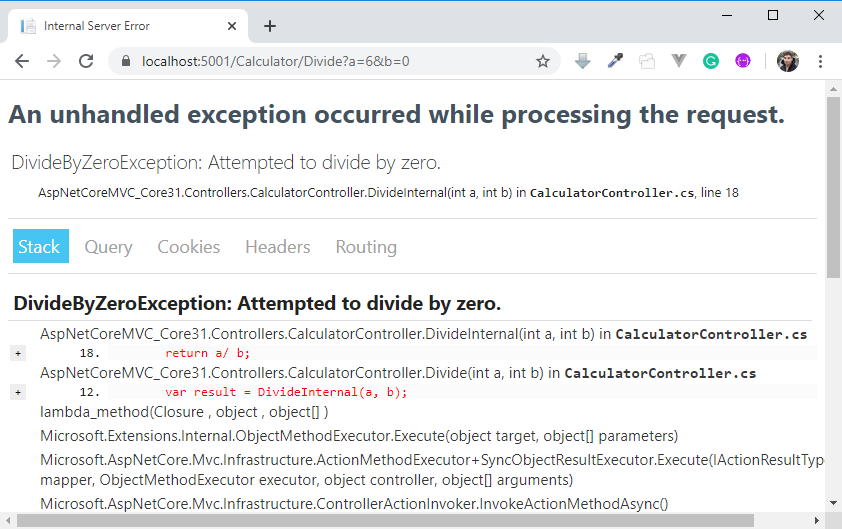
You can see the call stack and even the actual lines that led to the exception.
By default, this page shows only during development, which is configured in Startup.cs (if you’re using ASP.NET Core):
public void Configure(IApplicationBuilder app, IWebHostEnvironment env)
{
    if (env.IsDevelopment())
    {
        app.UseDeveloperExceptionPage();
    }
This code checks if the environment variable ASPNETCORE_ENVIRONMENT equals to Development (which it doesn’t when publishing to the cloud). But you can change it however you want. It’s probably not a great idea to show this exception page to your customers, but it can be helpful in QA and Staging environments.
Middleware to capture request-failure logs
ASP.NET Core’s middleware system is great for exception handling. You can easily create code that’s triggered when a request fails with an exception. It’s as simple as this:
public class ErrorLoggingMiddleware
{
    private readonly RequestDelegate _next;

    public ErrorLoggingMiddleware(RequestDelegate next)
    {
        _next = next;
    }

    public async Task Invoke(HttpContext context)
    {
        try
        {
            await _next(context);
        }
        catch (Exception e)
        {
            // Use your logging framework here to log the exception
            throw;
        }
    }
}
In the catch clause you can use your favorite logging framework
to log to a file, database, or wherever you want. Make sure to register the middleware:
public void Configure(IApplicationBuilder app, IWebHostEnvironment env)
{
    if (env.IsDevelopment())
    {
        app.UseDeveloperExceptionPage();
    }
    else
    {
        app.UseExceptionHandler("/Home/Error");
        app.UseHsts();
    }
    app.UseMiddleware<ErrorLoggingMiddleware>();
Check out this post
for more explanation on the ErrorLoggingMiddleware.
See Failures in Native Logs
Enabling logs that show request failures is somewhat elusive in Azure Portal and in the documentation. If you’re looking in the App Service logs and Log stream, then you’re in the wrong place. Instead, you’ll need to use the Core module stdout log.
To enable it, modify the web.config file in your application’s wwwroot. If you’re using Azure App Service, you can use Kudu tools
. Go to your App Service resource, Advanced Tools blade and click on Go. It will launch Kudu tools, which means it opens a browser tab with the URL https://[yoursite].scm.azurewebsites.net. From there, choose Debug Console | CMD, and navigate to site | wwwroot where you’ll find web.config. Click on the pencil icon to edit it.
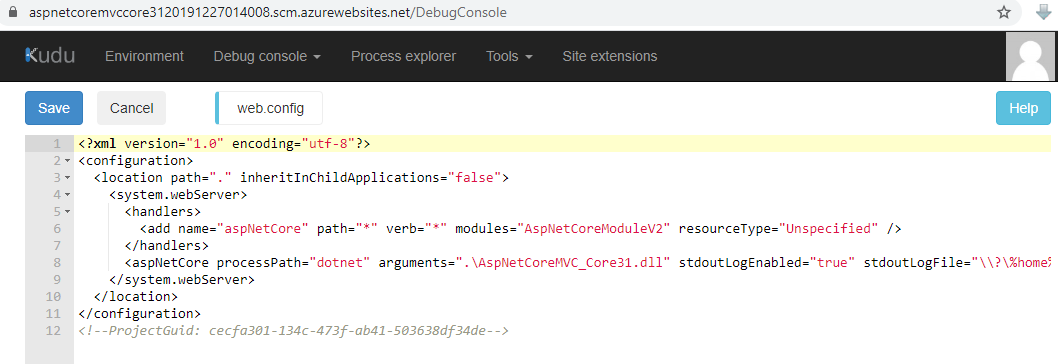
Set stdoutLogEnabled to true and stdoutLogFile to the path you want your log files to be. It can be something like .\logs\stdout and the log file will look like stdout_20191227125405_7832.log. In an Azure App Service, you can set it to \\?\%home%\LogFiles\stdout. Make sure the folder exists. If it doesn’t, create it manually or this won’t work.
This will create log files in the chosen location for each failed request. Each such log will write the exception type, exception message, and the stack trace. Like this:

These logs are especially great for application startup problems. Startup problems won’t appear in application insights or the Event Viewer, but they will appear here.
Make sure to turn off stdout logs when done. Failing to disable them can lead to app or server failure. There’s no limit on log file size or the number of log files created.
Use Error Monitoring Tools
Error Monitor Tools aggregate request failures for you. A few of them are elmah.io , Raygyn , and Application Insights. They will show your failures in a table where you can see how many times each type of error happened. An error type is an exception with a unique URL, Call Stack and Exception Type. So when an exception that has a different call stack or exception type occurs, it’s considered a different error.
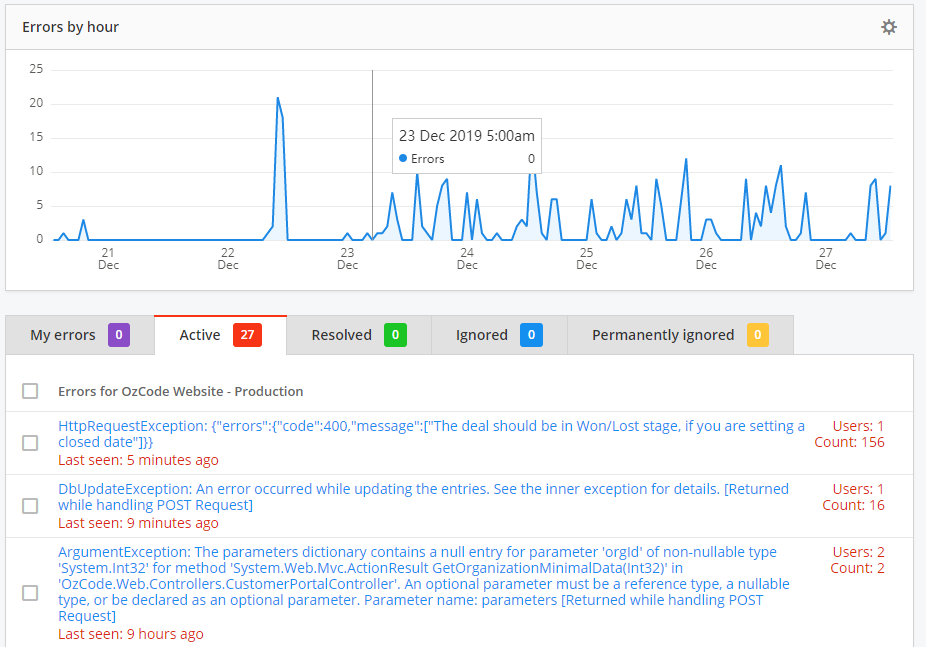
Besides the exception details, you’ll be able to see the failure count, number of users, IP addresses, and distribution over time. Some of these tools, like Raygun, can assign errors to developers and integrate with bug-tracking systems like Jira.
If you’re using an Application Performance Monitor (APM) tool like Application Insights, you can get even more information. APMs measure your server’s performance. So they record network requests, database requests, I/O operations, etc. That’s why you can see a sort of Timeline view of the request’s context – from the time it was received by the server up to the time it failed.
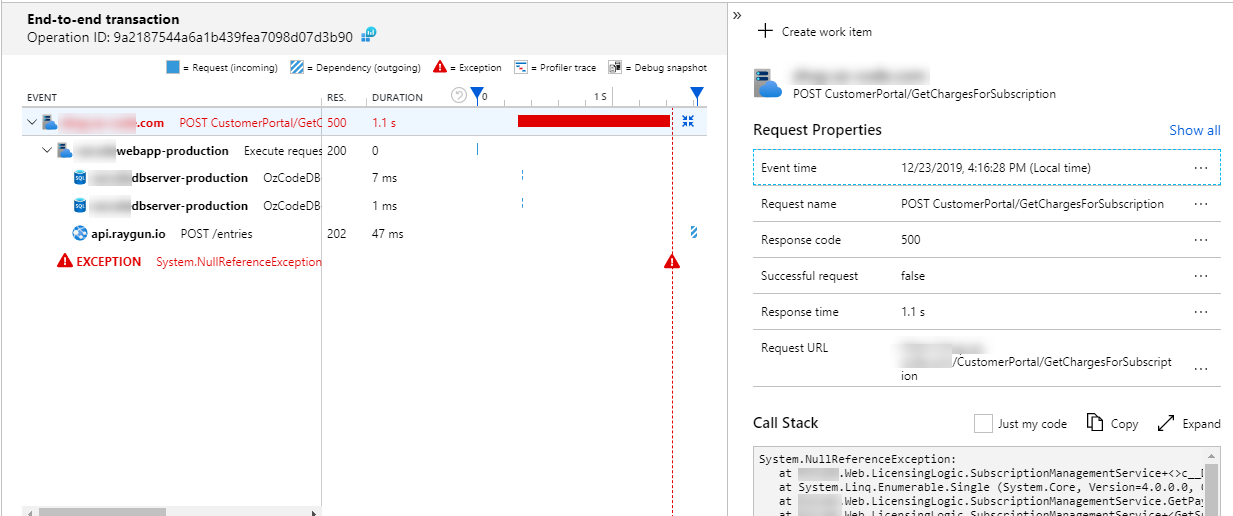
Besides the exception details (message, call stack) you can see that this request executed an HTTP POST call, a couple of database calls, another POST to Raygun, until it finally failed with a NullReferenceException.
Unfortunately, Application Insights doesn’t show the details of those events. I would like to be able to see HTTP request details – headers, query parameters, and request body. The same goes for database call details. I would have liked to see SQL queries and responses.
Using Application insights or an Error Monitoring tool like Raygun is probably the best way to monitor request failures. It’s much more practical than using stdout logs or the Event Viewer. However, it’s not always enough. Sometimes you’ll want to see more details – like local variables and object heap at the time of the exception. That’s what the next techniques will provide.
Break on Exceptions with Cloud Explorer
You can attach Visual Studio’s debugger to the Azure resource. It’s pretty simple with the Cloud Explorer. Go to Views | Cloud Explorer, connect to your Azure subscription, find your resource, and right-click to debug it.
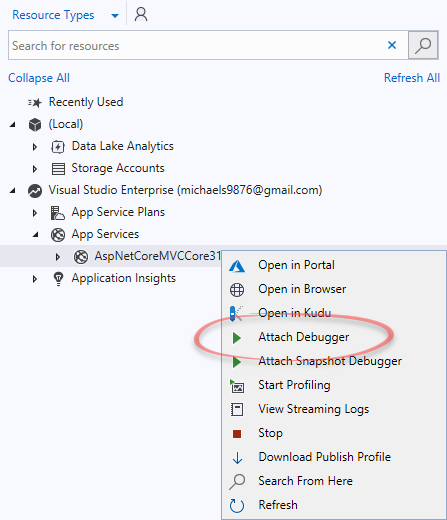
Your code will be considered “non-user” by Visual Studio. The reason is that production code is usually optimized, or you don’t have symbols deployed. To allow “non-user code” to work, go to Debug | Options and uncheck Enable Just my Code. If everything goes well (which is not guaranteed at all), you’ll be able to break on exceptions and debug them.
Problems with breaking on exceptions with the Cloud Explorer:
-
The biggest problem with this approach is that breaking the process means your server stops working. It stops serving requests, which is not something you want in production.
-
To see the line of code of the exception, you’ll need to have the exact same version of the source code that was built to create the binaries on the server. And symbols deployed.
-
The code on the server is usually optimized, which means you most likely won’t see local variables in the Locals window.
There are ways to overcome issues with code optimization and matching symbols to source code. Check out my article: Debugging 3rd Party .NET Code without symbols in Visual Studio .
Use Microsoft’s Snapshot Collector
Microsoft’s Snapshot Collector is a sort of extension to Application Insights. It’s been in Preview for over 2 years now. In theory, it promises an amazing debugging experience. When investigating the request failure in Application Insights, you’ll be able to see the exception (from production) inside Visual Studio, as if you’re debugging it on your development machine. You’ll see the code, the exception itself, the local variables, and the class members.
Follow these instructions to install it. You’ll need to have Application Insights(AI) installed and working as a prerequisite. With .NET Core 2+ versions it’s just a matter of a few clicks in Azure portal. In older versions, you’ll need to install the Snapshot Collector NuGet package and republish to Azure.
Once installed. The next web request failure you’ll encounter should have an Open debug snapshot button available in Application Insights. Although the same failure needs to happen at least twice and it will take 5-10 minutes for it to appear:

After clicking the Open debug snapshot button, you’ll see the call stack and the local variables. Another button Download Snapshot will appear. Clicking it will download a .diagsession file to your computer. This is a big file since it contains a Minidump
of your application. You can open it in VS Enterprise 2017 and above. When opening, Visual Studio proceeds as if you’re opening a regular dump.
You’ll have the same problems like with other dumps from production – Optimized code, possibly no symbols, and lack of original source code. Except that the snapshot debugger makes sure the last frame in the call stack is not optimized, so you will be able to see the local variables of the last frame.
Problems with Snapshot Debugger:
- The onboarding experience is a nightmare. I always encountered problems trying to set up the snapshot debugger.
- You need a VS Enterprise version to open the
.diagsessionfile. - It takes a lot of time for the Open debug snapshot button to appear after the failure, even with a small proof-of-concept application. Although the documentation says it should take 5-10 minutes.
- The exception has to happen at least twice for it to appear. You can change that to a bigger number so as to capture only the more common problems.
- Since the
.diagsessionfiles are so large, there are some very harsh limits on them. A maximum of 50 snapshots per day are retained and up to 15 days for each Application Insights instance. In a typical server, a bug might cause thousands of requests to fail in a day. The first 50 will exhaust this capacity and prevent you from investigating the errors you really want to dig into. - The entire experience is very slow. It takes forever to see the snapshot, open it, download it, open in Visual Studio and debug it.
Capture Dumps with ProcDump
It’s possible to capture a Dump file exactly when your web requests fail. You can then download the dump to your development machine and debug with: Visual Studio, WinDbg, or a memory profiler like SciTech’s memprofiler . This is very similar to what the snapshot debugger does, except that:
- Snapshot debugger captures Dumps automatically, whereas here you’ll have to do it manually.
- You can open the Dump in any VS version, no need to have VS Enterprise.
- The snapshot debugger makes sure the last frame of the exception is not optimized, whereas with here it will stay optimized.
- On the upside you don’t have to go through with the snapshot debugger’s set up experience.
The best tool to capture dumps in both Azure App Service, a Virtual Machine, or any machine hosting an ASP.NET application, is with a tool called ProcDump
. It’s a free, command-line tool, that’s part of the SysInternals tools suite
. You can download it from here
. But if you’re using an Azure App Service, it’s probably pre-installed in d:\devtools\sysinternals\procdump.exe and d:\devtools\sysinternals\procdump64.exe. Make sure to use the correct ProcDump version according to your process’s architecture.
You can have ProcDump to automatically create a dump file on some trigger. It might be when a CPU threshold is reached, when a memory limit is reached, on a crash, or on a first-chance exception. Since web request 500 errors are caused by exceptions, you can use that as a trigger. Use this command:
d:\devtools\sysinternals\procdump.exe -accepteula -ma -e 1 <process_id>
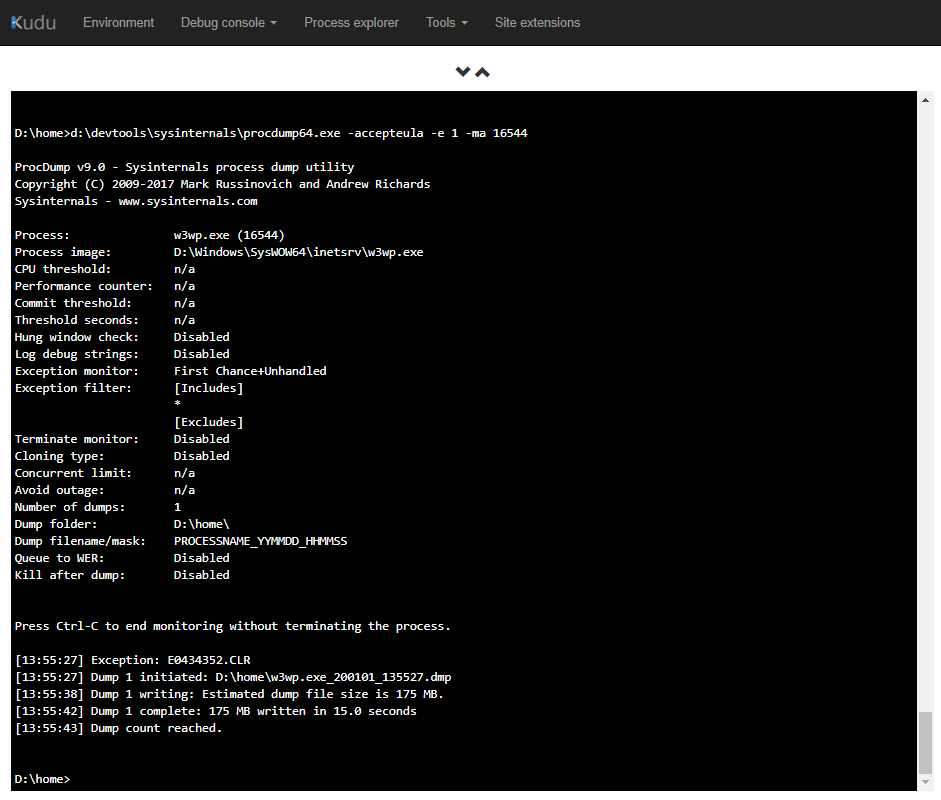
The -e 1 option tells ProcDump to break on first-chance exceptions. Omitting the 1 would break only on unhandled exceptions
. ASP.NET web requests are actually user-unhandled exceptions, handled by the framework itself. -accepteula silently accepts the user agreement. -ma is necessary to get a full memory dump. This will offer the best debugging experience when investigating. To get the process ID (16544 in the example), you can use Kudu’s process explorer:
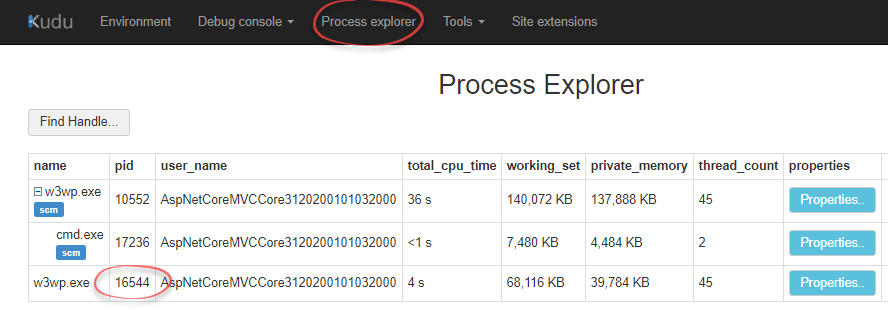
Use the -f command to break only on an exception of a certain type. Note that the exception name is a bit different than the ones you’re used to. For example, DivideByZeroException is actually DIVIDE_BY_ZERO as far as ProcDump is concerned. This command uses “contains” logic, so you can write something like:
d:\devtools\sysinternals\procdump.exe -accepteula -ma -e 1 -f Divide <process_id>
This will catch any exception that contains the word “Divide”.
TIP: Launching such a command will have ProcDump working indefinitely. If you want to stop it, pressing Ctrl + C doesn’t work in Kudu tools. You’ll need to go to Process Explorer, right-click on the cmd.exe process and kill it manually.
Investigating the Dump file
Once you’ve captured a Dump, download it to your development machine.

The easiest way to investigate dumps is to open them with Visual Studio. This will show you the exception, call stack, and possibly local variables. You won’t see the source code unless you have the exact source that was used to build and deploy this process. And you might not see local variables because the process is optimized in Release builds. There are ways to overcome these problems. Check out the following resources to see how to investigate Dumps and how to overcome said problems:
- How to Create, Use, and Debug .NET application Crash Dumps
- https://docs.microsoft.com/en-us/dotnet/framework/debug-trace-profile/making-an-image-easier-to-debug – Go to the part that talks about creating an INI file. This will allow telling the JIT compiler not to optimize code in the assembly. After creating the file, you’ll need to restart the application. When you’re done, make sure to remove the INI file and restart the app again. Unoptimized code hurts performance.
- Debugging 3rd Party .NET Code without symbols in Visual Studio
OzCode’s Production Debugger
You might know OzCode for its Visual Studio extension. OzCode is developing a new product that brings similar debugging capabilities to a production environment. Here’s how it works:
- Install OzCode’s agent to your Azure App Service / Virtual Machine with IIS / Docker container.
- When a web request fails due to an exception (500 error), you’ll see it in OzCode’s dashboard. This part is similar to other error-monitoring tools like Raygun or Application Insights.
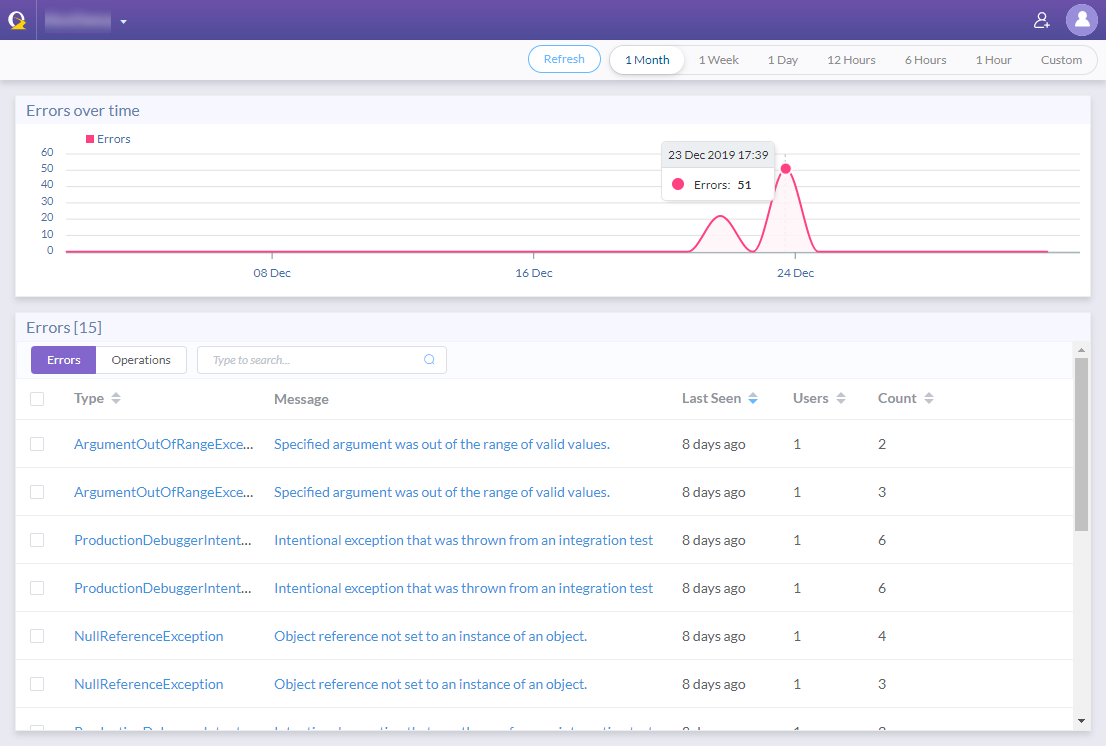
- The second time this exception happens, OzCode will collect additional data and allow you to debug the exception in your browser. Similarly to debugging with Visual Studio.
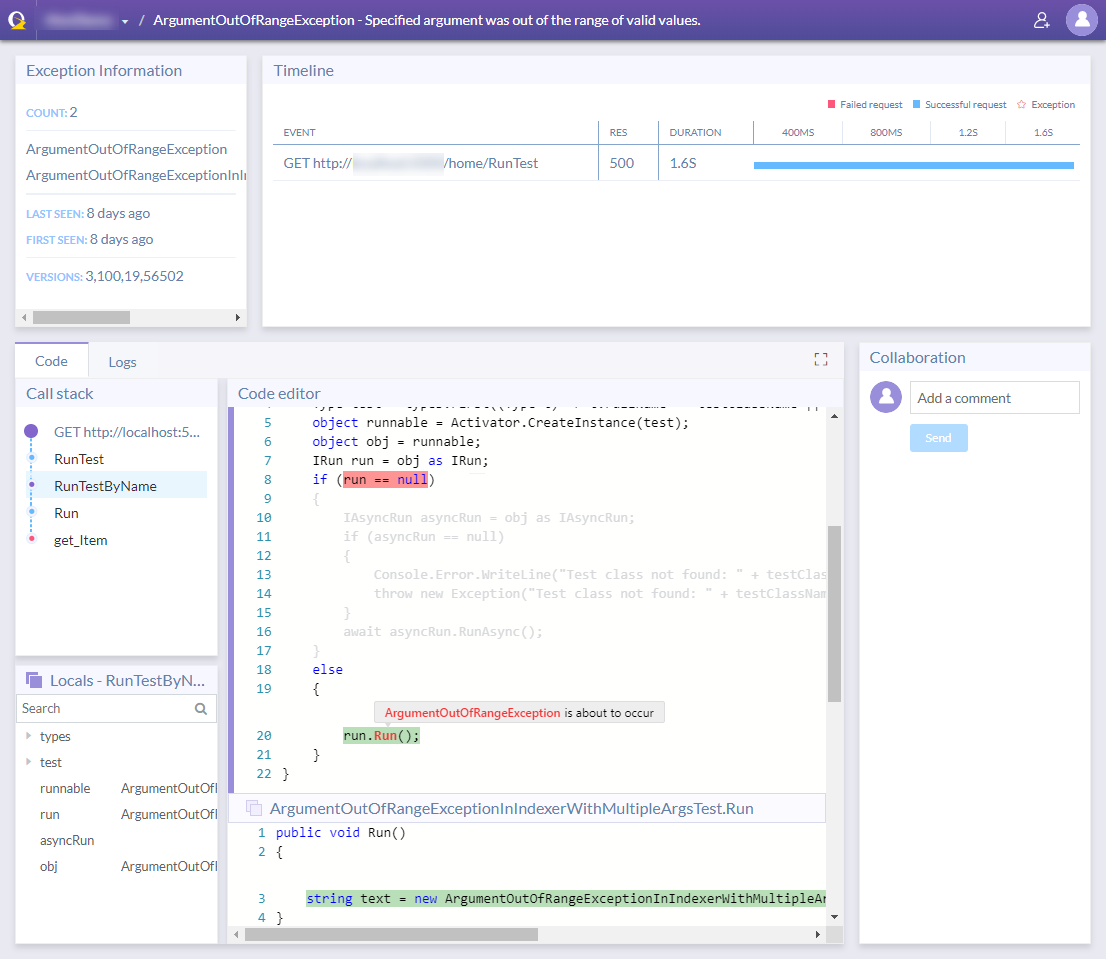
Unlike with other tools, OzCode shows information that you wouldn’t expect from a production environment. For each request failure you can see:
- The code, including the line of code that caused the exception. You’ll always see code, even if you deployed without symbols files. But it might be decompiled code.
- Local variables in all call stack frames (of the exception thread).
- Timeline events – HTTP requests, Database calls. Including payloads like request & response headers, request & response body, and SQL queries.
- Logs – Latest logs that were written before the exception. This including your regular logs that you logged with NLog , Serilog , or log4net .
This product is still in development, so you can’t use it just yet, but you can apply to the beta .
Summary
Production debugging is hard. It sometimes feels like we’re solving a problem blindfolded. That’s why we need to take the extra step and prepare our projects for debuggability. This includes setting up proper logging and using the best debugging tools. Hope this article helped you out. Please subscribe to get updates on new blog posts and bonus articles. Happy debugging.


