Performance Profiling of .NET Core 3 applications on Linux with dotnet-trace and PerfView

Performance issues never seem to disappear from the world, no matter how fast new computers become. To deal with those issues we need proper tools. In the world of .NET development, we can consider ourselves lucky in this regard. We have some of the best tools available, at least on Windows. On .NET Core with Linux, things are not so great. But they’re getting better.
With .NET Core 3, Microsoft introduced a bunch of new much-needed diagnostic tools:
- dotnet-counters to view Performance Counters.
- dotnet-dump to capture and analyze Dumps.
- dotnet-trace to capture runtime events equivalent to ETW events and sample CPU stacks.
In this article, we’re going to do some performance analysis with dotnet-trace and PerfView. But before that, let’s talk a bit about how we did things up to now, in Windows. And why we can’t do that with .NET Core in Linux.
Performance Profiling in Windows
I already said we have some great tools on Windows. Let’s go over them:
1. Classic Performance profilers
There are 3 major performance profilers in the .NET market:
- JetBrain’s dotTrace
- ANTS Performance Profiler
- Visual Studio’s performance profiler. This one is still not as good as the others in my opinion.
A profiler allows you to record a runtime snapshot and analyze it for performance issues. You’ll be able to break execution time into methods and find out how much time each method took. You’ll see time of network requests, I/O requests, system code vs user code and a myriad of other metrics to help you figure out the problem.
Unfortunately, these profilers don’t run on Linux (although they do support .NET Core apps on Windows).
Update: dotTrace early access 2019.3 command line tools now support profiling .NET Core apps on Linux. Rider early access 2019.3 can now profile on a Linux machine with a dotTrace extension. Thanks to @falconandy for the update.
2. Performance Counters
Performance counters show a bunch of metrics to get an overall sense of your app’s performance. Those include:
- % Processor Time (Total or per process)
- Private Bytes – Shows process memory (both managed and native).
- Gen X Collections – Number of garbage collector collections in the generation.
- IO Data Bytes/sec – Bytes written or read to file/network or another resource.
- # of Exceptions thrown / sec – A large number of (first-chance) exceptions thrown in a second can significantly hurt performance.
And hundreds more.
Just looking at performance counters can indicate if you have a CPU problem, an I/O problem, a contention problem or a problem with too many exceptions.
Linux has a sort of equivalent tool called Perf but we don’t have an easy way to consume these counters like with PerfMon on Windows. The new dotnet-counters solves this problem and allows to easily consume performance counters from .NET Core on Linux.
3. ETW Events and CPU Stacks Profiling with PerfView
Another way to profile performance problems is with PerfView ‘s CPU Stack sampling. PerfView is a great tool to analyze ETW events, GC and CPU usage. It’s less intuitive than the commercial performance profilers but in some ways more powerful.
Here’s the general idea of how we do performance profiling with PerfView: First, collect system-wide CPU Stack samples every millisecond (or every X milliseconds). When done collecting, we filter down to a single process and analyze the data much like in a classic performance profiler. You’ll be able to see which methods took the most execution time, method call trees, thread times, and even method call distribution histogram (more on that later).
Analyzing with PerfView adds less performance overhead than attaching a classic performance profiler, which allows you to use it in production environments. It’s also free.
Up to now, you could have used PerfCollect to collect performance trace on Linux (.NET Core 2.1+) and analyze in PerfView. Now you can do it with dotnet-trace as well (.NET Core 3+). There are many differences between dotnet-trace and PerfCollect which are described here . I think dotnet-trace is easier to use and to analyze the data. It also uses a cross-platform mechanism called EventPipe that’s built into .NET Core 3.0. This means your analysis is going to be similar on all platforms. In this article, we’re going to use the newer dotnet-trace.
Performance Profiling .NET Core on Linux – Getting Started
Here are the steps I followed to collect a performance trace on Linux:
- Linux machine – For this article, I used Oracle’s VirtualBox VM
and Ubuntu 18 Desktop ISO
. After setting up the VM, I installed the .NET Core 3 runtime and SDK as shown in this guide
. I installed the dotnet-trace tool with the command:
dotnet tool install --global dotnet-trace. - Project to profile – I created a small Console .NET Core 3.0 C# project (available on GitHub ) that we’re going to profile on Linux. The project is taking a number of integers as input and then sorts them in different ways – Bubble sort, Quick Sort, and Merge sort. To publish for .NET Core, I ran the following command:
dotnet publish --configuration Release
This created the folder bin\Release\netcoreapp3.0\publish.
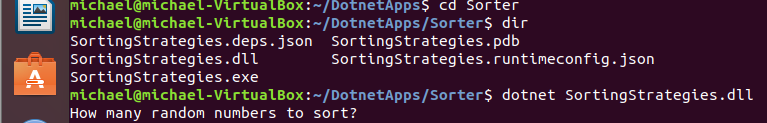
- Execute on Linux – Once installed, I copied the
publishfolder to the Linux machine and ran it with thedotnetcommand:
- Collect a trace – To attach to the process, dotnet-trace allows to list .NET Core processes with the
list-processescommand:
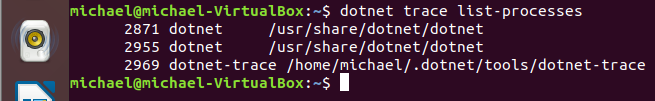
For some reason, there are always two different processes listed when running the application (2871 & 2955). In any case, the first one is the one relevant.
Unfortunately, dotnet-trace can only attach to a running process, not start it (at least not yet). So profiling issues at startup is still impossible.
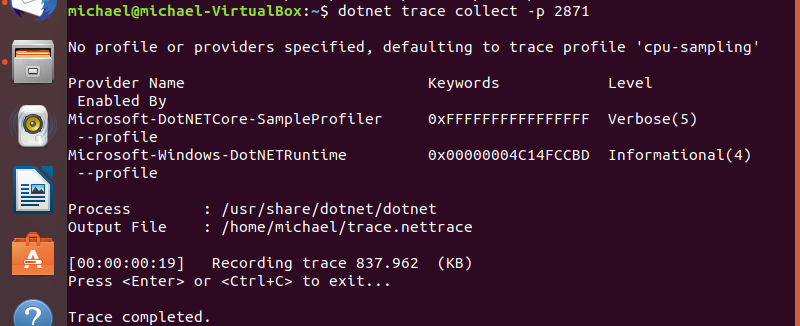
Next, I ran this command to do the actual trace collection: dotnet trace collect -p 2871. While the collection was recorded, I completed the Console app scenario.

Once the process exited, the dotnet-trace tool finished as well, creating a trace.nettrace file.
- I copied the
trace.nettraceoutput file to Windows
Analyze trace with PerfView
Now that the collection part is over, it’s time to analyze the results. Let’s open trace.nettrace file in PerfView
. We get the following options:
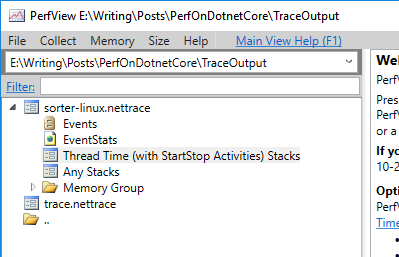
We’re interested in Thread Time here, which will give CPU Stacks samples of all threads.
Once opened, you can go straight to CallTree tab to get the following:
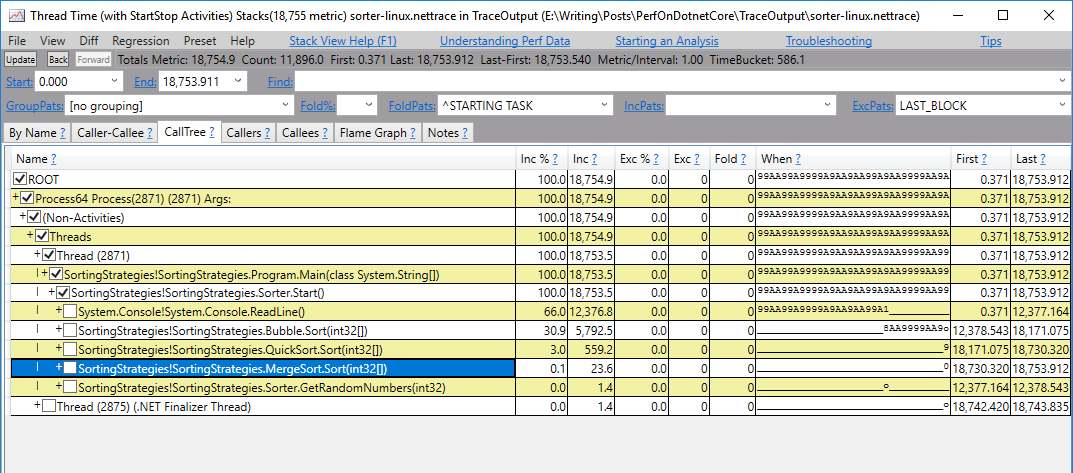
So that’s a whole bunch of information in one screen, but the Name column is pretty straightforward. It shows the calling hierarchy in the process. The thread called the method Main which then called Sorter.Start which called ReadLine(), Bubble.Sort(), QuickSort.Sort(), MergeSort.Sort(), and GetRandomNumbers().
We can look at the column Inc % that shows the execution percentage this method took including the time taken by the methods it called (callees). You can see that the Bubble sort function took 30.9% of all execution time, Quicksort function took 3% and Merge sort took just 0.1%. Bubble sort took the longest, which makes sense. But if you know a thing or two about sorting algorithms, then you might suspect there’s a problem here. Merge sort and Quicksort are both O(n*log(n)) (well, Quicksort is that on average) and it doesn’t make sense that merge sort is so much quicker. We’ll analyze that a bit later on.
Let’s talk more about what we see in this window, starting from the columns
- Name – name of the method. It also can be a group of functions according to the GroupPats strategy.
- Inc % – Execution time percentage out of entire collected sample, including methods called by this one (callees)
- Inc – Same as Inc % except that the metric is in the number of samples. So if we’re taking a sample once a millisecond (default) then it roughly represents the number of milliseconds spent in this method.
- Exc % – Execution time percentage out of entire collected sample taken by this method only (Own time), excluding callees.
- Exc – Same as Exc % except that the metric is in the number of samples.
- Fold – How many were folded into this method.
- When – Represents the method calls distribution over time. Starting from left (start of the trace) to right (end of trace). For example, in the above collection, you can see that Bubble Sort was executed from about 60% into the collection to pretty much the very end.
- First – Time of the first sample (milliseconds from the start of the trace).
- Last – Time of the last sample (milliseconds from the start of the trace).
If you look at the GroupPats input (top-right corner), you’ll see it’s set to [no grouping]. Unlike in Windows traces, the default of a dotnet-trace is [group module entries] which groups all methods from a single module into one line until another module is called. Without going into too many details on grouping and folding, the [no grouping] option that I used, expands all lines. A better tactic would be to start from module grouping, find the SortingStrategies module of this application and ungroup it. An even better one is the default setting on Windows called [Just my app] which ungroups your own application’s methods and groups everything else. Unfortunately, this option is still missing when importing from Linux. For more detail on grouping and folding watch this tutorial by Vance Morrison.
By Name Tab
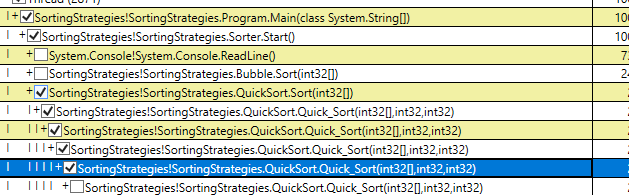
Let’s investigate the strange difference between Quick Sort and Merge sort. Specifically, I’d like to analyze Quicksort and see why it’s so slow.
Expanding QuickSort.Sort() simply shows a lot of recursive calls that don’t help much.
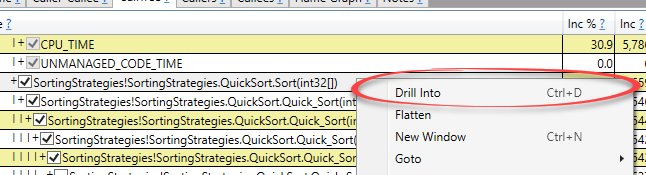
To help the investigation, we can minimize the analysis to include just Quick Sort time with the Drill Into functionality. This will remove all other CPU stacks.
Now, let’s move to the By Name tab, which shows just a flat list of methods:
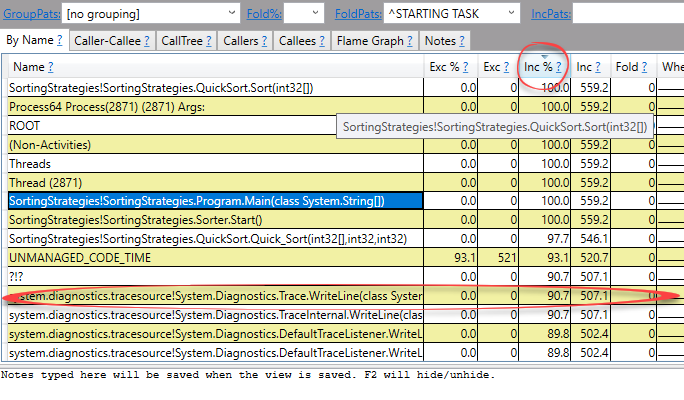
I usually sort this table by Inc % which includes callees for each method (includes the time of the methods it called). You can see that Trace.WriteLine took 90.7% of the entire execution time. So for some reason, the QuickSort.Sort() method calls Trace.WriteLine() which destroys its performance. With this new information, it’s going to be easy to find the problem. Check out the source code
of QuickSort and try to find it yourself.
Summary and Resources
In this post, we saw how to do performance profiling on a .NET Core 3 process on Linux. This involved installing the dotnet SDK, then installing the dotnet-trace tool, collecting a trace of your .NET Core process, copying the trace file to a Windows machine and analyzing with PerfView.
This is probably the best way to do performance analysis today on Linux. Having said that, you can also analyze with PerfCollect and other tools as shown in this very interesting talk by Sasha Goldstein: Debugging and Profiling .NET Core Apps on Linux .
I’d love to see my favorite tools (dotTrace , dotMemory , ANTS profilers ) run on Linux. I don’t think there’s any hope for ANTS profiler to support it, but there’s some hope with JetBrains. They seem to support dotTrace for the Mono runtime, but not .NET Core. This is nice for their Rider customers that use Mono runtime with Unity 3D on Mac, but doesn’t help us mainstream .NET developers. Fingers crossed.
More Resources
Here’s the official blog post by Microsoft announcing the new diagnostic tools in .NET Core 3 (dotnet-trace, dotnet-dump, and dotnet-counters): Introducing diagnostics improvements in .NET Core 3.0 . Interesting read.
To learn more on PerfView, I really recommend the video tutorials by Vance Morrison on Channel 9.