New browser APIs to detect JavaScript performance problems in production
Today’s users expect the best experience possible, and that means top-notch performance. They expect smooth scrolling, immediate interaction responses, fast page load time, and flawless animations. That’s easier said than done. As web applications scale and grow in functionality, it becomes increasingly difficult to know when performance issues appear.
Profiling locally to find performance problems is convenient, but gives you very limited information. While things might work well in our high-end developer machines, the user can have a weak device and a terrible experience. Or the user can use your app in ways you never thought of and bothered to check. The only way to prove an application works well is to get real data from production. But how to do that exactly? How can we accurately measure the performance health of our application in production? That’s exactly what you’ll see in this article. There are several brilliant new APIs and techniques to extract performance measurements from end-user sessions. They are in various stages of proposal and implementation in the browsers, but all of the ones described are implemented in the latest versions of Chromium.
You’ll see 4 different ways to get performance data. I suggest reading all of them because I’m saving the best for last. But first, let’s talk a bit about definitions and what counts as “bad performance”.
Defining Bad Performance
Let’s approach the issue of good performance from the user’s perspective. If the user experiences a fast and smooth application, the performance is good and healthy. But if the user experiences unresponsiveness or janky animations and scrolling, the performance can be defined as bad.
A lot of research was done on how users perceive delays . As a result, a performance structure called RAIL was born. It defines a behavior model that’s considered as performant UX. It can be summarized as follows:
- Users perceive a response to a user action as immediate when it’s under 100 milliseconds.
- Users perceive animations and scrolling as smooth when they are drawn at 60 frames per second. That gives us 16 milliseconds for each frame.
- A task feels natural when it takes from 100ms to 1000ms. Loading pages or changing views are examples of tasks.
We’ll concentrate mostly on part (1), which is user action responses. Within this scope, we’ll talk only about JavaScript code that causes long tasks. Those are JS event handlers and functions that block the main thread and cause delays over 100ms.
We won’t talk about the DOM render process. This post is all about JavaScript.
50ms or 100ms
According to RAIL, we should respond to user input within 100ms. But when that input occurs, another task might be in progress. That’s called an idle task because it’s running during idle time. We need the idle task and our own input handling to finish within 100ms. We can be sure this is happening if each of our tasks finishes within 50 milliseconds. So our task budget is actually 50ms and not 100ms (read more about this here ).
Any task that runs more than 50ms is considered a long task. A JS task might be an event handler for user input, some code you run with setTimeout, a callback for requestAnimationFrame, or a promise callback.
Here’s our prime directive: To improve performance health we should find long tasks in production sessions and report them with enough context to be able to be able to solve the problem.
So let’s see some ways to do just that:
1. Manually adding stopwatches
Before diving into newer APIs, let’s talk about the classic way you would get performance measurements from production.
The simplest way is to save a timestamp before and after an operation, like this:
HTML:
<button onclick="myfunc()">Click me</button>
JS:
function myfunc() {
	const start = performance.now();
	// ...
	const duration = performance.now() - start;
	// report duration
}
Note that I’m using the performance.now() API, which is somewhat better suited for perf measurements
than Date.now(), and supported in all browsers.
This technique is very simple and effective. If you report the duration to a telemetry database, you can analyze the results and find tasks exceeding 50 milliseconds. Combined with other logs in this context, assuming you report those as well, you’ll have a lot of information to find out the reason for the long task.
The problem with this approach is that you’ll have to add this code to any function you’d want to measure. This will make the codebase pretty bloated, not to mention all the work required. You can use automatic instrumentation techniques, like adding this code around every function during the build phase. Such instrumentation is certainly a valid option, but that will probably cause performance problems where they didn’t exist before, skewing the reported data.
I often use such stopwatches around performance-sensitive code that I’m working to improve right now. After my work is done, I remove the stopwatch code.
2. Long Task API
The Long Task API is able to detect all tasks taking over 50ms and report some basic information on them including duration, the iframe responsible (more or less), the DOM container responsible, and the type of work causing it (script, layout. etc.).
Here’s how you can use it:
const observer = new PerformanceObserver(function(list) {
  for (const entry of list.getEntries()) {
     // report back for analytics and monitoring

     console.log(entry);
  }
});

// Register observer for long task notifications.
// Since the "buffered" flag is set, longtasks that already occurred are received.
observer.observe({type: "longtask", buffered: true});
Let’s break down this code. The PerformanceObserver (as part of Performance Timeline ) exposes a bunch of performance-related functionality that provide high-resolution time specification. The high-resolution part is actually not supported anymore because of security reasons (see spectre attack ), but we do still get the values rounded up to 1 millisecond or so (depending on the browser).
To use the Long Task API, we create a PerformanceObserver and listen to “longtask” events. When there are issues, the observer’s callback is called with a batch of all the entries since the last time it was called. I believed a batch is called on each frame’s idle time, so you’ll get all the entries as soon as the main thread is free. Each such entry represents a long task.
Let’s say that on clicking a button my event handler took 52 milliseconds. The above code will output something like this:
attribution: Array(1)
	0: TaskAttributionTiming
        containerId: ""
        containerName: ""
        containerSrc: ""
        containerType: "window"
        duration: 0
        entryType: "taskattribution"
        name: "unknown"
        startTime: 0
duration: 52
entryType: "longtask"
name: "self"
startTime: 2104.879999998957
The output shows that there was one long task that took 52ms (if my function would run under 50ms, it wouldn’t trigger the API). The name self shows that it’s not in an iframe, but rather in the self window. startTime shows when the long task started.
Even though the Long Task API doesn’t say which functions ran during the long task, it’s still very useful information. You can investigate logs right before and after the long task occurred. Or you can aggregate long tasks amount and duration to create a performance health metric. With this metric, you can detect performance regressions. Or you can do A/B tests to see whether some performance optimization reduced the number of long tasks.
I love this API because it gives powerful insights from production without any extreme measures like having to instrument my entire code.
Right now Long Task API is available in all Chromium-based browsers but not in Firefox or Safari.
3. Event Timing API
The Event Timing API is specific to long tasks caused by user interaction. If an event for something like a button click executes over 100ms, the observer callback will be called. You’ll be able to get information on the duration of the task, the event name, and the event’s DOM object.
The tricky part of event handlers is that the time the function runs isn’t really the time the user interaction takes because the processing of the event handler doesn’t start immediately. That’s why regular stopwatches don’t really provide accurate information. When the user does something, like clicking a button, the main thread might be in the middle of something else. The action is queued and only when the main thread is free, it can process the event. This API gives you both the duration of the event handler and the duration since the user interaction started. This relates to our 50ms task rule—if all tasks are 50ms or less, the entire operation is going to be under 100ms.
Here’s an example.
HTML:
<button onclick="myfunc()" id="mybutton">Click me</button>
JS:
const performanceObserver = new PerformanceObserver((entries) => {
  for (const entry of entries.getEntries()) {
    // Checking 'click' here but a simple button click will also produce 'mouseover', 'mouseout', and 'mouseup'events
	if (entry.name == 'click') {
      // The input delay: delta between hardware timestamp and when event handlers start being executed.
      const delay = entry.processingStart - entry.startTime;
      // The amount of time that it takes for all event handlers of this event to run.
      const handlersDuration = entry.processingEnd - entry.processingStart;
      // 'duration' captures from hardware timestamp to next paint after handlers run.
      const duration = entry.duration;
      // target could be null, for instance for events that only have shadow DOM targets.
      const id = entry.target ? entry.target.id : 'unknown target id';

	  console.log(entry);
      console.log("duration:", duration, "handlersDuration:", handlersDuration, "Target Id:", id);
    }
  }
});

performanceObserver.observe({entryTypes:['event']});
Assuming the button’s event handler myfunc runs for 150ms, the output will be something like this:
PerformanceEventTiming
	duration: 168
	entryType: "event"
	name: "click"
	processingEnd: 1731.0949999955483
	processingStart: 1580.664999986766
	startTime: 1577.709999983199
	target: button#mybutton

duration: 168 handlersDuration: 150.43000000878237 Target Id: mybutton
Like before, we’re using the PerformanceObserver interface, except the entry is now a PerformanceEventTiming type. Note that we’re observing event and not longtask like in the previous API.
We can see both the duration of the event handler and the entire duration from the moment of the user action until all event handlers finished working. This allows for more fine-tuned performance work where you can detect problems that you have no other way of discovering.
This API also gives a lot of information with virtually no effort. You can get your hands on the event name and even the actual DOM element, which makes finding and solving performance issues much easier.
Like with the Long Task API, Event Timing API is only available in Chromium browsers .
Using both Long Task API and Event Timing API together
PerformanceObserver allows to observe several entry types with a single instance. Here’s an example for this:
function handleEvent(entry) {
  console.log("Event entry", entry);
}

function handleLongTask(entry) {
  console.log("Long task entry", entry);
}

const performanceObserver = new PerformanceObserver((entries) => {
  for (const entry of entries.getEntries()) {
	switch(entry.entryType) {
	  case 'event':
		handleEvent(entry);
		break;
	  case 'longtask':
		handleLongTask(entry);
		break;
	}
  }
});

performanceObserver.observe({entryTypes:['event', 'longtask']});
4. JS Self Profiling API
The APIs we talked about so far give us a lot of information but it’s not yet the perfect experience. In my wildest dreams, I would want something similar to local profiling, in the sense that I can look at some kind of a timeline view showing all the call stacks that were called and their duration. Similar to the Performance view in Chrome DevTools.
This is exactly what the JS profiling API does. It acts like a full blown sampling profiler that you can run within the browser. Once you start the profiler, it records call stacks of the currently running functions every 10 milliseconds or so.
Here’s an example:
HTML:
<button onclick="myfunc()" id="mybutton">Click me</button>
JS:
var profiler;

async function init() {
	profiler = await performance.profile({ sampleInterval: 10 });
}
init();

async function myfunc() {
	pausecomp(150);

	const trace = await profiler.stop();
	console.log(trace);
}

function pausecomp(millis) {
	var date = new Date();
	var curDate = null;
	do { curDate = new Date(); }
	while (curDate - date < millis);
}
The function init starts the profiler with an interval of 10ms (in reality the interval is 16ms), at which point performance.profile() is called and the profiler starts recording call stacks. When done profiling, you would call profiler.stop() and receive an object with the recorded samples.
In the example above, when clicking on the button, the function myfunc pauses for 150ms, then stops the profiler and prints the call stack samples.
I clicked on the button about 2300 milliseconds after page load. This is the result:
samples: Array(148)
[0 … 147]
0: {stackId: 2, timestamp: 101.6949999902863}
1: {timestamp: 128.4600000071805}
2: {timestamp: 143.61500000813976}
... (more empty samples)
135: {timestamp: 2363.76000000746}
136: {timestamp: 2379.3249999871477}
137: {stackId: 5, timestamp: 2394.479999988107}
138: {stackId: 5, timestamp: 2310.530000009807}
139: {stackId: 5, timestamp: 2425.4150000051595}
140: {stackId: 5, timestamp: 2440.694999997504}
141: {stackId: 5, timestamp: 2456.4400000090245}
142: {stackId: 5, timestamp: 2471.530000009807}
143: {stackId: 5, timestamp: 2487.4500000150874}
144: {stackId: 5, timestamp: 2503.434999991441}
145: {stackId: 5, timestamp: 2519.575000012992}
146: {stackId: 5, timestamp: 2534.58999999566}
147: {stackId: 6, timestamp: 2543.130000005476}

stacks: Array(7)
0: {frameId: 2}
1: {frameId: 1, parentId: 0}
2: {frameId: 0, parentId: 1}
3: {frameId: 5}
4: {frameId: 4, parentId: 3}
5: {frameId: 3, parentId: 4}
6: {frameId: 6, parentId: 4}
length: 7

frames: Array(7)
0: {name: "profile"}
1: {column: 21, line: 39, name: "init", resourceId: 0}
2: {column: 9, line: 35, name: "", resourceId: 0}
3: {column: 20, line: 62, name: "pausecomp", resourceId: 0}
4: {column: 23, line: 49, name: "myfunc", resourceId: 0}
5: {column: 42, line: 77, name: "", resourceId: 0}
6: {name: "stop"}
Did I mention already this API was proposed and contributed by Facebook?
Anyway, let’s break down this output. Looking at samples, up to about sample #136 nothing happened. JavaScript functions didn’t run and the profiler recorded empty stacks. From frame 137 to frame 146 each sample had the stackId 5, which means the same functions ran for 10 samples in a row. Looking at stacks, in the 5th element, the frameId is 3, which represents the bottom function in the call stack. In frames, you can see that the 3rd element is the pausecomp function. The parentId 4 is the parent substack up to this function. Looking at stacks output again, you can see that the 4th element represents the function myfunc and parentId 3, which in turn represents an empty function with no parent.
So from frame 137 to frame 146 the call stack was myfunc which called pausecomp.
From this output, you can merge the samples and figure out durations for each function. For example, in our case, we see that both functions myfunc and pausecomp ran for 160ms (10 samples at 16ms interval).
We can consider samples in between empty stacks as tasks. If a task is over 100ms, it is considered a long task according to our RAIL definition from before. Once the profiler identified a long task, you can report it to telemetry, investigate, and profit.
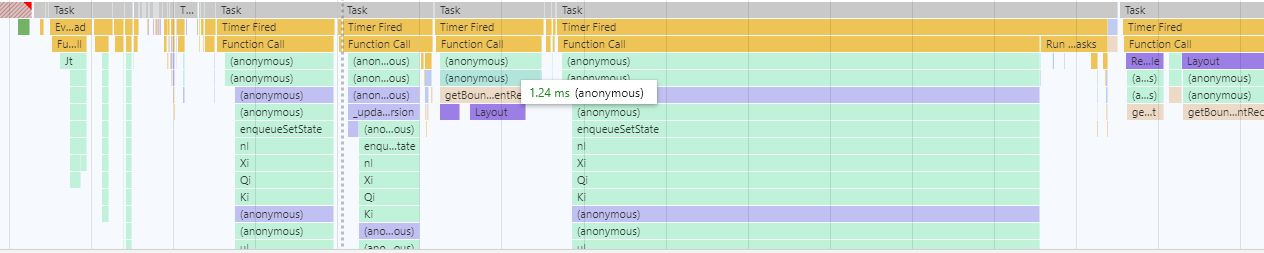
A cool way to debug these outputs is to convert them to Google’s Trace Event Format , which allows to import and visualize the samples in Chrome DevTools “Performance” tab.
Caveats
JS Self profiling API is not quite production-ready. It’s still in the experimental stage. To use it locally, you’ll have to run chrome with the feature flag chrome --enable-blink-features=ExperimentalJSProfiler.
Using it on your site is currently impossible. Up to a few months ago, you could have registered for a trial, but it has ended and the feature didn’t become publicly available yet. Having said that, I’m following this closely and I believe this API will be generally available in the coming months.
There is some security concern with exposing timing information (see spectre attack ). There are also concerns about cross-origin leakage, which made the chromium team introduce a cross-origin isolation requirement for the API, though there’s discussion about removing this.
So this API is not quite ready, but it’s definitely worth the wait.
Finishing up
We saw three APIs that give us a bunch of performance insights pretty much for free. That is, you don’t need to go over all of your code and add stopwatches or any kind of instrumentations. All three can be aggregated into some kind of “health metric” that will allow you to detect performance regressions or do A/B testing for perf optimizations. This kind of metric is a huge step beyond any type of manual testing or user feedback. It’s like the equivalent of a unit test suite to your app’s performance. Moreover, the last API allows full blown profiling in production, which is pretty amazing. I think we’ll see in the near future more browsers adopting these, get even more perf APIs, and get to see the amazing JS Self Profiling API reaching general availability in 2021.