
6 Essential Tools to Detect and Fix Performance Issues in .NET

I don’t know about you, but I’ve been battling with performance problems all my career. And I’ll probably keep doing that all the way to retirement. For some reason, perf issues never seem to end. And the bigger the project gets, no matter how much effort your team puts into optimization, the performance problems keep piling up. So I came to accept the point of view that performance problems just mean you’re successful. It’s an indication that you’ve made it. If you don’t have performance issues, then you don’t have enough users for the current point of development, and you should start worrying. With this optimistic point of view, let’s talk about how to deal with those problems.
Performance issues can be very difficult if you don’t have the right tools. If you have the optics into the core of the matter, then half of the battle is already won. And the best way to get that kind of visibility is by knowing which tools to use. But there’s the problem of you don’t know what you don’t know. And if you aren’t even aware of what kind of tools exist and what they can show, you can find yourself fumbling in a dark room, looking for a needle in a haystack (did I get that right?). If you know that there are tools that can see metrics from production, see method execution times, and find slow database queries, you will have made your problems much easier. Luckily, there are plenty of excellent tools in the space of .NET. These can help you detect, monitor, optimize, and fix performance issues. Both locally and in the cloud.
It’s a big field and there are probably hundreds of tools out there, but they can be grouped into a small number of categories. Let’s see some of those categories as well as some specific tools:
1. Performance Counters and PerfMon
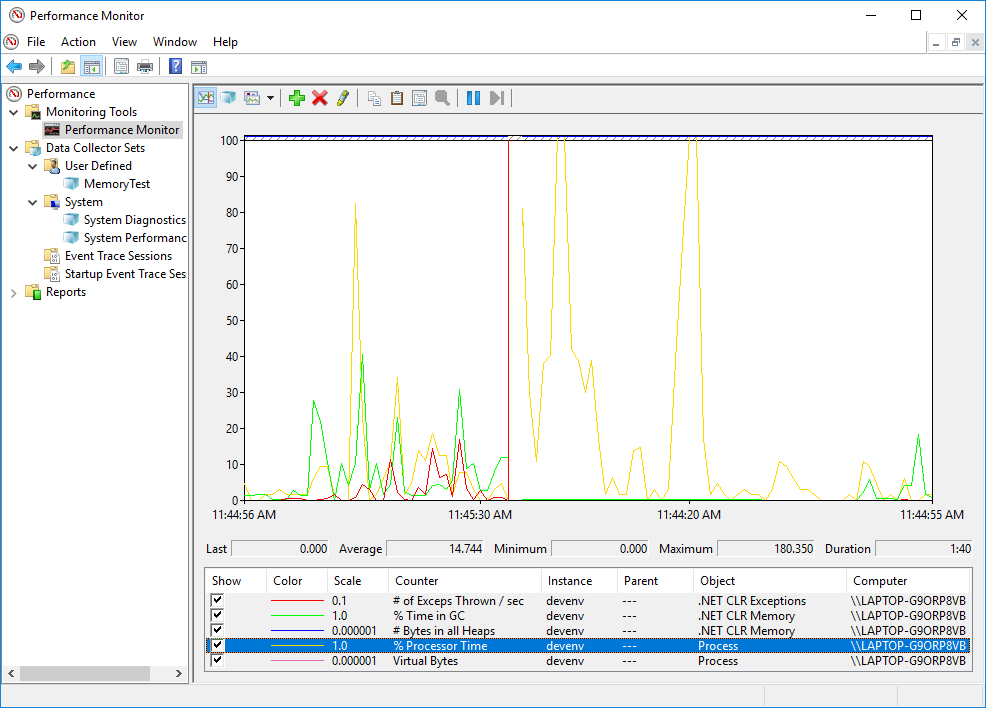
The operating system and the CLR provide a ton of information about a .NET process in the form of Performance Counters . These are a built-in mechanism in Windows that allows you to follow a whole lot of useful metrics. Performance counters are easy to use, come free, and perhaps not utilized as much as they deserve.
So what kind of information are we talking about here? Well, some examples are: CPU Usage, memory usage, exceptions thrown rate, ASP.NET request rate, ASP.NET request response time, and many more. There are hundreds of different counters you can monitor and they come as specific as possible. For example, if you want to find out about Memory Usage of a process, there are counters for Private Bytes, Virtual Bytes, Working Set, Working Set – Private, Gen X Collections, % Time in GC, Large Object Heap Size, and many more.
Those metrics are crucial to monitor a .NET process and make sure it has great performance. For example, if your CPU usage is 100% on all threads, then you know you have a performance problem. Even better, you know it’s a CPU-bound issue so you can make some assumptions right there. Or if the counter % Time in GC is over 20%, then you probably have a GC Pressure problem. The garbage collector uses too much of the execution time, which means threads are frozen a big chunk of the time, and performance will be bad. The cause might be memory leaks, some cache mechanism that you don’t invalidate, or just too little memory available for your usage.
When working locally in Windows, you can use PerfMon to observe performance counters.
On Linux, you can use the command-line tool dotnet-counters .
To get information from production, you can consume performance counters in code, like this:
var currentProcess = Process.GetCurrentProcess().ProcessName;
PerformanceCounter privateBytes =
    new PerformanceCounter(categoryName:"Process", counterName:"Private Bytes", instanceName:currentProcess);
PerformanceCounter gen2Collections =
    new PerformanceCounter(categoryName:".NET CLR Memory", counterName:"# Gen 2 Collections", instanceName:currentProcess);
Debug.WriteLine("private bytes = " + privateBytes.NextValue());
Debug.WriteLine("gen 2 collections = " + gen2Collections.NextValue());
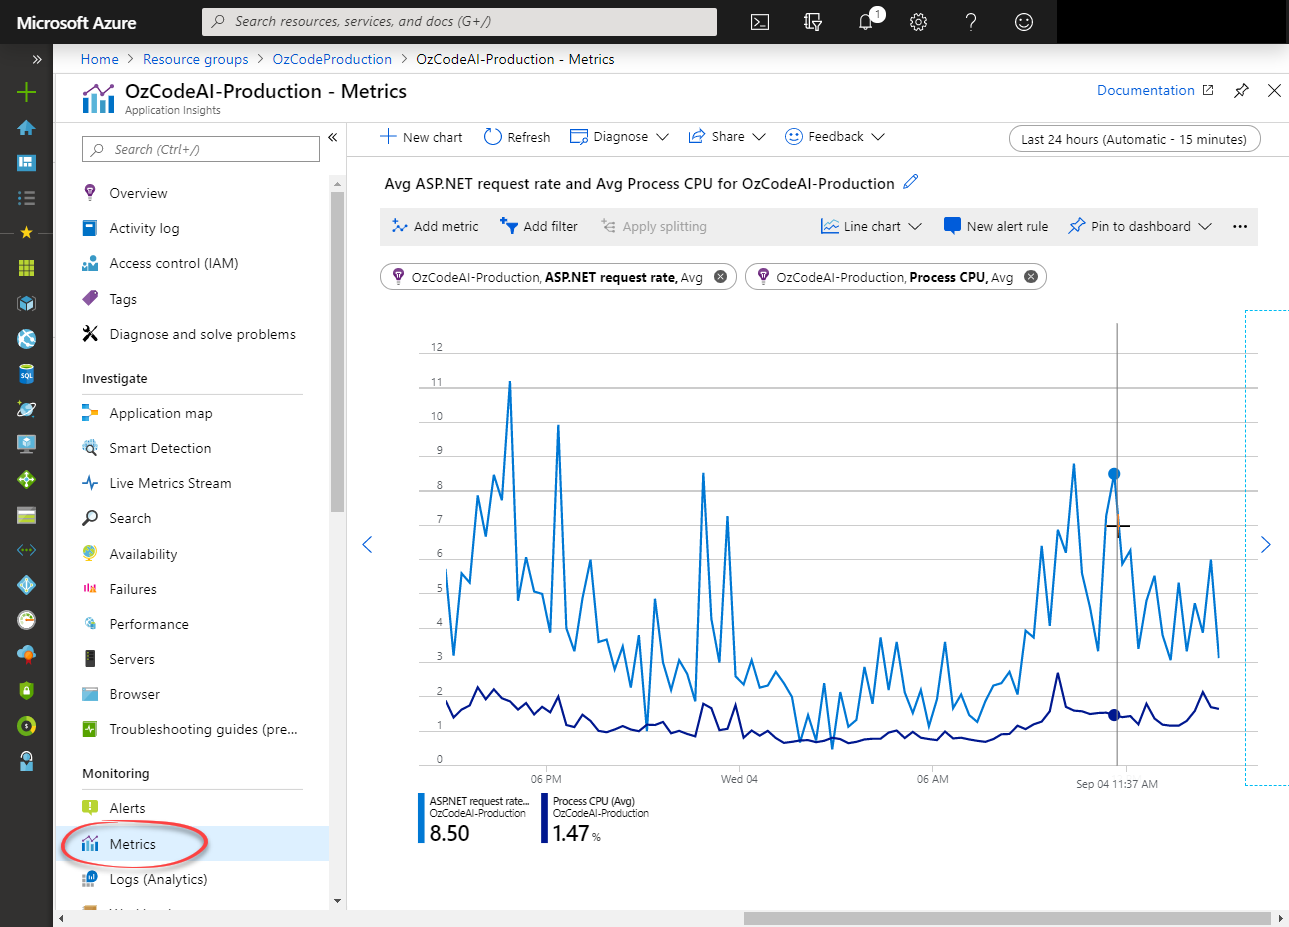
Or if you’re using an APM (we’ll talk about those in a bit), most of them will be able to show you this data without additional effort and even create alerts when things go wrong. Here’s how Application Insights shows it:
2. Performance Profilers
Another super important tool to detect and fix performance issues is a performance profiler. These profilers are able to record your .NET process for some period of time and then give visibility about what went on inside. This information is all you can dream of in performance analysis: it shows all the methods that were executed, the amount of time spent in each method, and the number of times each method was called (in certain modes). In one easy run of a performance profiler, you’ll be able to pinpoint the perf issue in the application.
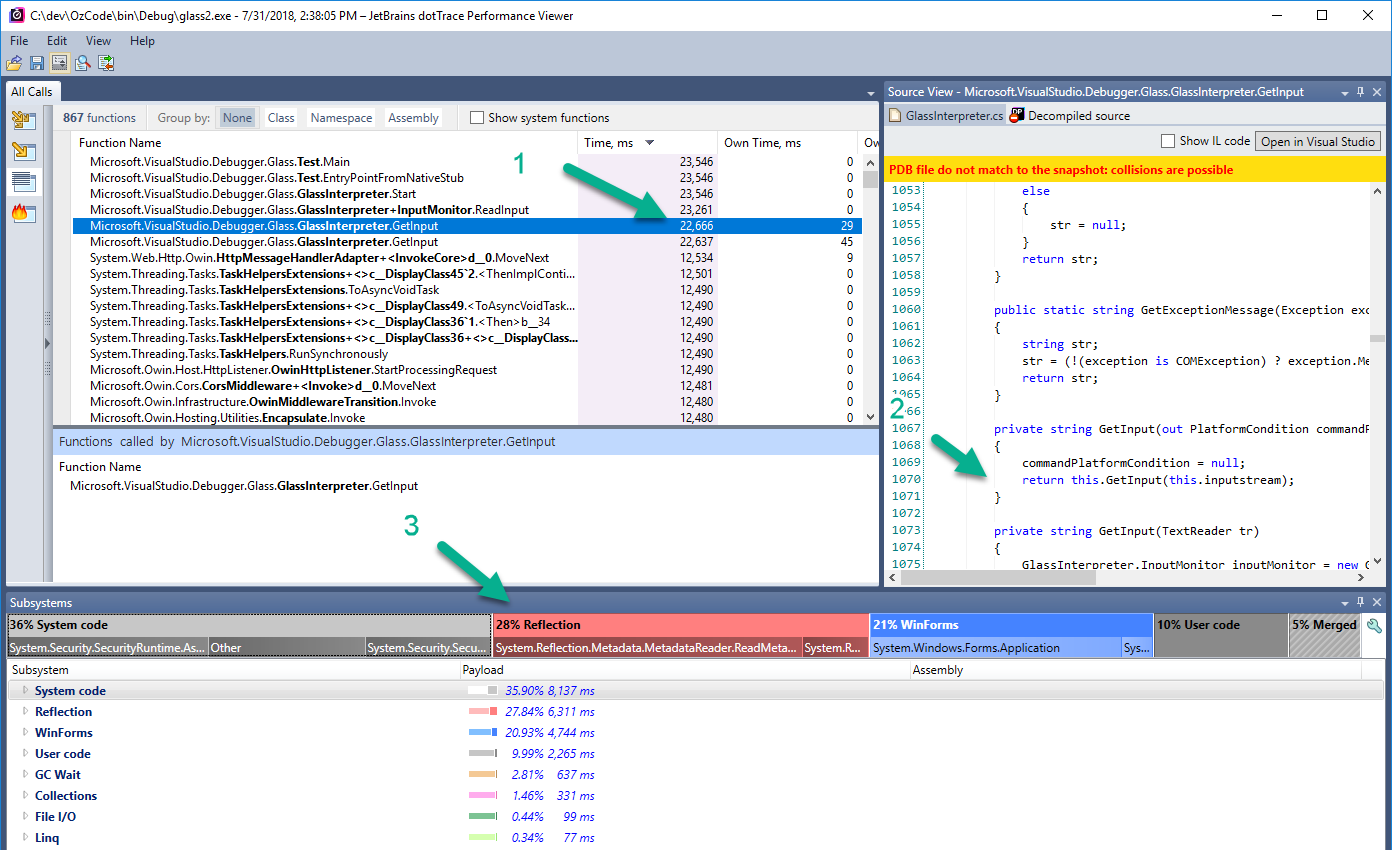
In the above image, for example, (taken from dotTrace
) you can see the method GetInput took 22 seconds (1), the code of that method (2), and that it used 36% system code, 28% reflection, and 21% WinForms code (3). And there’s much more information to get from the snapshot other than this view.
Some of the most popular performance profilers are dotTrace , ANTS performance profiler , and Visual Studio profiling tools . There’s also PerfView, but it’s a bit different, and I placed it in its own category.
Performance profilers are usually executed locally, in your dev environment. But you can attach a profiler to a process in production with some caveats. For one thing, the profiler itself has some performance overhead when attached, and you probably won’t want to degrade your perf in production. For another, attaching to a process in production is pretty tricky. You’ll either have to attach remotely, which rarely works well in my experience, or copy a profiler agent to the production machine, attach from there, and then copy the performance snapshot back to a dev machine for analysis. Besides being a cumbersome process, it can be hard to analyze a production machine when there are a bunch of random user requests going on in parallel. You might be hard-pressed to pinpoint a specific issue. Another way to go is to get profile snapshots using an APM (coming up next), which is going to save you a lot of trouble, or with PerfView, which is going to save you a lot of performance overhead.
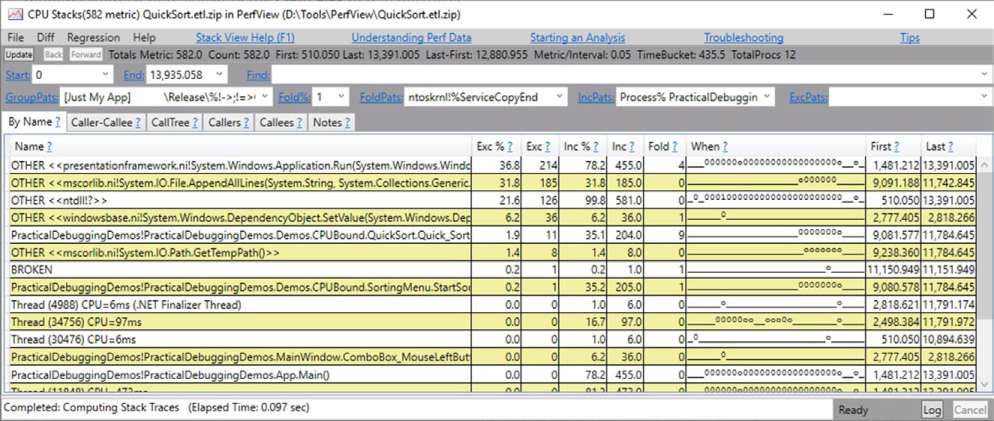
3. PerfView
If you are familiar with PerfView, you might say it’s another performance profiler, same as dotTrace or ANTS performance profiler , but I think it can be categorized a bit differently. So let’s first talk about what exactly is PerfView. It is an open-source analysis tool by Microsoft that relies mainly on ETW events . It can perform performance profiling, memory profiling, and a whole lot of various diagnostics reports on your .NET process.
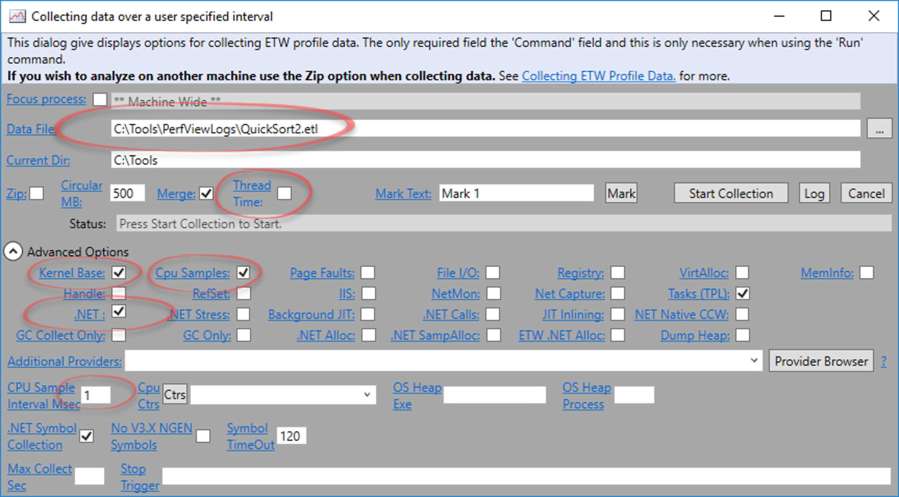
The reason I’m placing this in a different category than performance profilers is that I think a regular performance profiler doesn’t replace PerfView and PerfView doesn’t replace a regular profiler. I’ll tell you why in a minute, but first let’s talk about what’s so special in PerfView. For one thing, it’s extremely customizable. So much so that you can extensively configure PerfView to how much or how little information you want it to capture. For example, when sampling performance you can change the sample interval from 1/8th of a millisecond up to 10 milliseconds or more. You can change whether to capture garbage collection information, thread change information (to be able to see async call stacks), whether to limit file capture size, whether to stop capture on CPU spike, on memory spike, on performance counter value or after some time passed. Why is all this important? Because it allows profiling with a very low performance overhead, as low as 3% . Combine that with a light-weight program that you can copy to a production machine, and a powerful command-line interface, and you can effectively profile production environments. So in this way, PerfView is different from a classic performance profiler.
The other thing about PerfView is that’s it’s very not intuitive. It has a ton of different settings that make it very hard to find your way around it and to get any sort of insights from it. You can easily deduct wrong conclusions because of not being familiar with one of its many subtleties. That’s the other side of the coin and why I think knowing PerfView doesn’t replace knowing a regular (and much easier) performance profiler.
Just to mention some more things that PerfView can do better than other performance profilers: profile both managed and native code, see the timeline view of when each method was called in the snapshot recording (also available in dotTrace Timeline Profiling ), profile memory allocations, find memory leaks by comparing memory snapshots, see garbage collection reports, and more. In a way, PerfView is also a powerful memory profiler.
I mentioned before that PerfView is suitable for profiling in production. And while it’s very powerful, bear in mind that’s it’s very difficult to set up. That’s why you might be better off with APMs. Some APMS actually use PerfView under the hood, but save you the trouble of all the configuration and show the results more intuitively.
4. Application Performance Monitoring tools (APMs)
Application Performance Monitoring tools give an inside-the-hood view of your application’s performance and health in production. They will be able to show things like request counts and duration, CPU and memory on each machine, database query durations, traffic on each service , crashes, performance counters, exceptions, and more. Some of them will even be able to show code level performance profiling information , similar to what you see in a regular performance profiler when running locally. Other than that, APMs usually offer a logging storage target: a centralized database where you can send all your logs to.
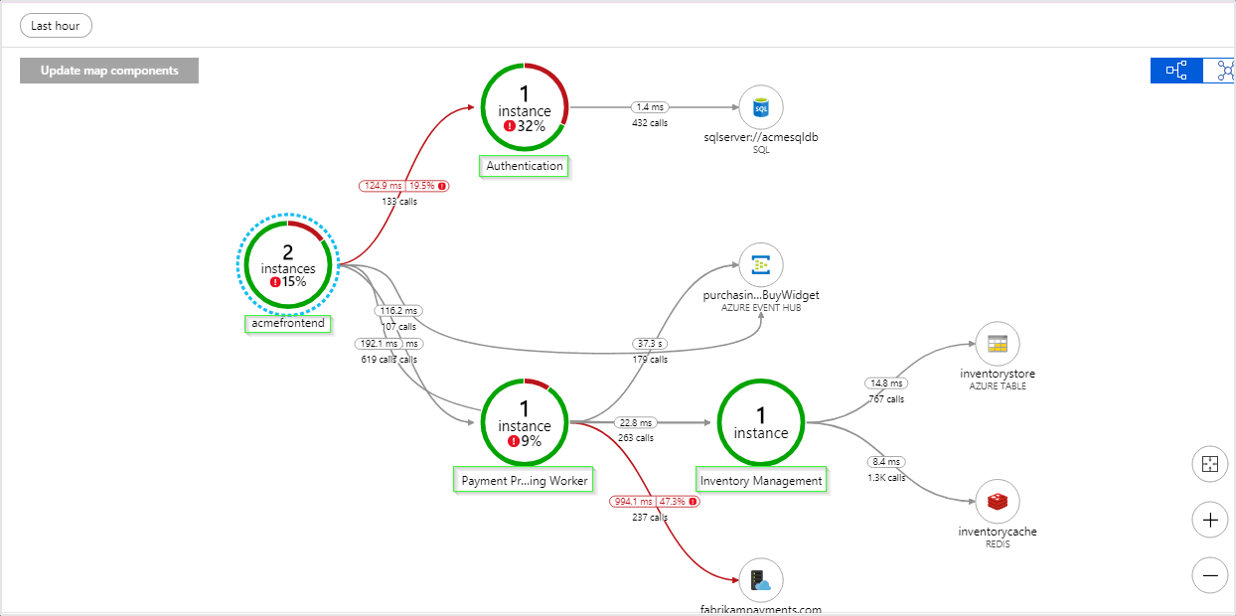
As you can imagine, APMs are extremely useful for detecting performance problems in production. You can find the slowest requests and investigate them. You can see CPU and memory issues. You can go over database queries and find the slowest ones. You can even profile and see flame graphs of requests that you want to investigate (not all APMs support this).
APMs work by installing lean agents on your production machines. Those agents will either collect ETW logs of your .NET process (same as PerfView does) or attach to your .NET process as a profiler, which gives them access to .NET Profiling API . Or both.
So who are the big players in the .NET space? The most widely used APM is probably Application Insights (now part of Azure Monitor), since it comes out of the box when using Azure. Other than that you have New Relic , AppDynamics , Raygun , Datadog , Stackify , Dynatrace , and many more.
5. BenchmarkDotNet
BenchmarkDotNet is a .NET library that allows you to measure execution times and create benchmarks. This is useful when you want to optimize some method locally and you’re trying to figure out what implementation works best. When you have, for example, two different implementations for something that executes in a hot spot in your code.
Comparing execution times can be tricky. You have to run the execution a bunch of times and calculate mean time, consider things like CPU warm-up and CPU cache, memory allocations, different CLR implementations, code optimization, and the list goes on. There are many pitfalls when doing a good benchmark. Luckily, there’s no reason for you to think of any of those things because BenchmarkDotNet takes care of everything.
public class Md5VsSha256
{
	private const int N = 10000;
	private readonly byte[] data;

	private readonly SHA256 sha256 = SHA256.Create();
	private readonly MD5 md5 = MD5.Create();

	public Md5VsSha256()
	{
		data = new byte[N];
		new Random(42).NextBytes(data);
	}

	[Benchmark]
	public byte[] Sha256() => sha256.ComputeHash(data);

	[Benchmark]
	public byte[] Md5() => md5.ComputeHash(data);
}

public class Program
{
	public static void Main(string[] args)
	{
		var summary = BenchmarkRunner.Run(typeof(Program).Assembly);
	}
}
Another usage of BenchmarkDotNet is to integrate it with your continuous integration and tests. When you have algorithms that are the core of your business, you’d want to be completely safe from any kind of bug degrading their performance. And if you want these measurements done reliably, you can count on BenchmarkDotNet.
6. Logs
You might be wondering why I placed plain old logs next to all the other powerful tools in the list. The reason is that logs are a crucial part of an application’s performance management. Logs are still the absolute best source of information from production. They are infinitely more reliable and granular than any kind of tool (like an APM).
To get reliable information from production, like how much time some method runs on average, or how long a database query took, you can use simple stopwatches and log the elapsed time. Here’s a simple example:
public void MyMethod()
{
	Stopwatch myMethodTime = Stopwatch.StartNew();
	try
	{
		// ...
	}
	finally
	{
        myMethodTime.Stop();
		_logger.log($"MyMethod took {myMethodTime.ElapsedMilliseconds} milliseconds");
	}
}
Or you can use some kind of decorator, base method, wrapper or attribute pattern.
The usual practice is to place such stopwatches in performance-critical areas of your code or in places where you already detected a performance problem. Then, you can start optimizing the perf issue and see reliable production data to find out if your changes improved or regressed performance.
When analyzing execution time, make sure to look at percentiles and not the average. Averages can paint a very misleading picture. For example, suppose that a method runs for 1ms in 90% of cases and 100ms in 10% of the cases. The average will be 11ms. Does it represent the actual situation? Not really, because in reality the method is working fine in 90% of cases and there’s some bug or issue that happens in the other 10%. The average would just tell you that the method is working 10 times slower than it should be, which is misleading.
Here’s an example query in KQL that goes over logs and show percentiles:
Logs
| parse Message With "MyMethod took " duration: int "milliseconds"
| summarize avg(duration), percentiles(duration, 50,75,90, 95)
The result will be in our case:
| average_duration | percentile_duration_50 | percentile_Duration_75 | percentile_Duration_90 | percentile_Duration_95 |
|---|---|---|---|---|
| 11 | 1 | 1 | 100 | 100 |
Finishing up
We saw 6 different tools, or rather categories of tools, that help to deal with performance issues. Some of those run locally and measure benchmarks or detect problems. Other tools can run in your staging or production environments and gather real-usage data from there. Some tools are able to get general information like CPU usage, memory levels, and network traffic volume. While others can get more specific and show method execution times, database query time durations, and memory allocations. Some tools, like APMs, do a whole lot with minimal effort. Other technologies, like logs, require much more work by the developer, but in many ways provide better information.
The reason I think this list is extremely useful is that it gives you a bird’s eye view of the capabilities these tools can provide. Once you know that there’s a thing like performance counters that can easily show CPU usage, garbage collection activity, or request rate, you won’t rely on guesswork when a problem occurs. If you know that there are performance profilers that you can run locally or in production, you’ll be able to use them to pinpoint the exact root cause of a performance issue, preventing a long journey of guesswork and experimentation.
So I hope this was useful to you. If you want to know more about these tools, and about troubleshooting performance problems in general, check out my book Practical Debugging for .NET Developers that goes in-depth on these issues.


Great stuff Michael, thanks for sharing