5 Tricks You Should Know About Visual Studio’s Immediate Window

This article was originally written for the Ozcode blog .
There’s a window in Visual Studio that enables you to run and evaluate any code you’d like. That magical windows is the Immediate window. To use it all you need to do is write valid code, such as: System.Console.Write(“Hello”), and presto:

The Immediate Window looks pretty straightforward, but it hides some cool features. In this post, I’ll show you five tricks you can use with this window that you absolutely should know if you want to debug faster.
1. You can debug any methods called from the Immediate window
Let’s say you’re debugging something and a method returns a strange result. You might want to execute that method again to find out how you got this result, but you’re already past that point in the code. With the Immediate Window, that’s not an issue. You can place a breakpoint in the method that you want to debug and call it in the Immediate Window. The breakpoint will be hit and you’ll be able to debug the method.
Note that you can also use the Run to a cursor location (Ctrl + Shift + F10) feature to go back to any line of code in Visual Studio (in the same scope). Then, step into methods with F11 and debug as usual.
2. Method access rules don’t apply for the Immediate window
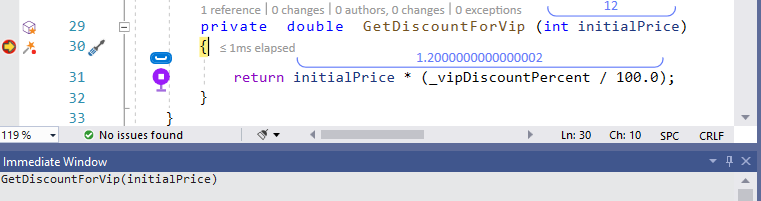
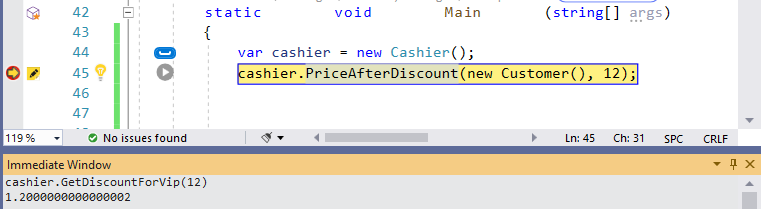
In most cases, anything you write in the Immediate window acts the same as if you wrote it in the code. But there’s a difference when it comes to class accessibility rules – they don’t apply in the Immediate window. You can call private, protected, and internal members that are not accessible in regular code. In the following example, the GetDiscountForVip() method is private, but I can still call it in the Immediate Window.
The IntelliSense still works as usual though, and you’ll see just the public methods.
3. Evaluate with no side effects
Evaluating an expression in the Immediate Window can cause side effects. Variable values can change, and methods can be called. You can interact with a database, with files, and with the network. You can do anything you want, just like in regular code. This behavior isn’t obvious, and not something you always want.
For example, consider this class:
class MyClass
{
    public int number = 0;

    public int Foo(int a)
    {
        number++;
        return a + 1;
    }
}
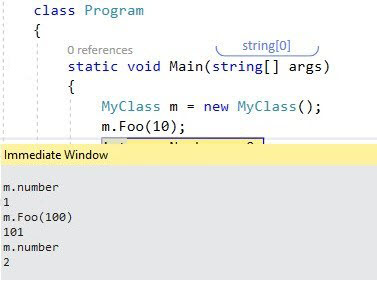
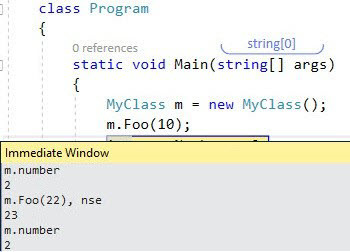
If I evaluate Foo() in the Immediate Window, number will increase and the application state will change.
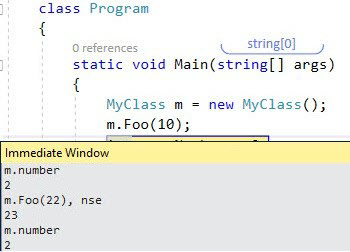
If that’s not something you want, you can avoid it. Just add the , nse (no side effects) postfix to an expression, and it will evaluate without changing the application state.
As you may discover, “no side effects” doesn’t work for all expressions. In some cases, it’s impossible to evaluate an expression without side effects. For example, you can’t make a network request in this mode because there’s no way to guarantee that it won’t have side effects.
4. Access special variables – $exception, $returnvalue, and $user
Visual Studio has some special variables during debugging, and the Immediate window can show their value.
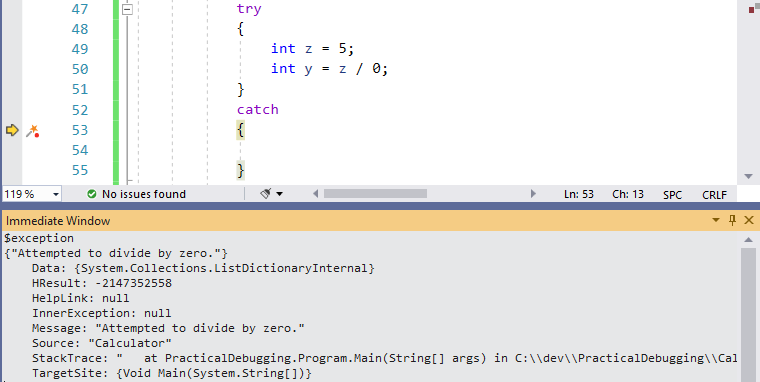
$exceptionevaluates the currently thrown exception. It’s available at the point the exception is thrown, and also in thecatchclause if it’s caught. That’s extremely useful in cases that you didn’t add theExceptionparameter in thecatchclause.
$returnvalueshows the return value of the currently returned method. This is very useful if you didn’t assign that return value to a variable. In the example below,cashier.PriceAfterDiscount()returned 11. Note that you have to break on the method’s execution line and then step over (with F10) that line of code for$returnvalueto work. If you stepped into the method (with F11), then$returnvaluewill be available when you step out. This is the time to make a note of that value because it will be gone as soon as you continue to the next line of code.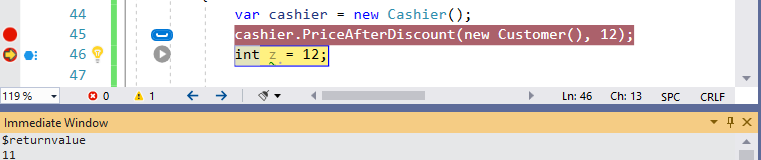
$usershows the current OS user and process information. This includes the machine name, the process privileges, and some other security related details.
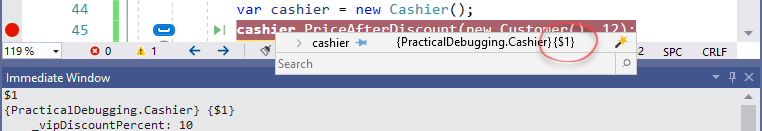
5. Evaluate Make Object ID
If you hover over any variable during debugging, you’ll see that the DataTip allows to “Make Object ID”:
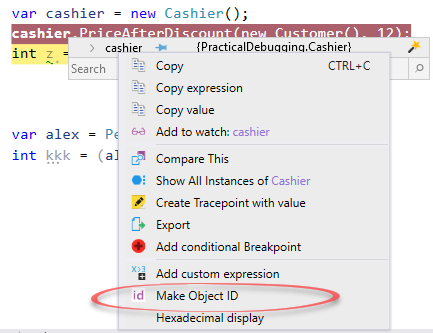
If you find this DataTip a bit strange, that’s because I’m using Ozcode Visual Studio Extension . But the default Visual Studio DataTip has the same feature.
Make Object ID creates a unique identifier for the given object that starts with $1 ($1, $2, etc). You can evaluate this expression at any time, regardless of the current scope in the Immediate Window. After making an object ID, you can continue execution with F5, hit another breakpoint, and evaluate $1 to see how that object’s value changed or if it even exists in memory anymore. Under the hood, Make Object ID creates a weak reference to the object so that it will not interfere with its garbage collection.
There’s always something new to be learned
Whenever I think I know everything about Visual Studio, I’m proven wrong and find something new. There’s so much to this tool we use every day, that you’re always discovering more features. As you can see, the Immediate Window lets you use some neat tricks, which have proven very useful to me in many debugging sessions.
Some of these tricks can also be used in the Watch windows, although those have their own tricks as well. But that’s for another blog post.