This tutorial is part of a series:- Part 1 – Getting started with Visual Studio Debugging
- Part 2 – Visual Studio Debugging Tool Windows
Unfortunately, writing code goes hand in hand with creating bugs. We all cause bugs, it’s one of the inevitable facts of life. This process of solving those bugs is called Debugging.
Debugging comes in many forms: Stepping through the code with a debugger, investigating logs, unit testing, profiling, and analyzing dumps. As .NET developers, our main form of debugging is interactive debugging, with Visual Studio. Interactive debugging means attaching to a running process with a debugger, and investigating the program’s execution and state.
Visual Studio (VS) is not the only debugger at our disposal (we also have WinDbg , Rider , and dnSpy ). But, Visual Studio is the most widely used and the focus of this article. VS might seem easy to start with, but it has a great many features that are crucial to effective debugging. Mastering Visual Studio debugging will decrease debugging time and turn you into a more effective developer.
This article takes you through the slippery ropes of VS debugging from a beginner to an expert debugger. We are not going to cover the more specific tips and tricks of .NET debugging (There are other articles for that). We are going to build the fundamentals of debugging – A foundation of knowledge for you to become a master of debugging in Visual Studio.
This first part is for beginners to debugging, starting from the very basics.
1. Attaching the debugger
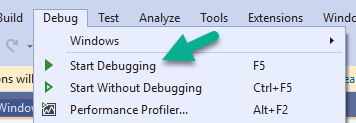
Debugging in Visual Studio occurs automatically when you run from Visual Studio with F5 or select Debug | Start Debugging.
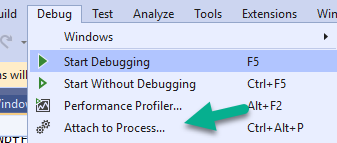
When doing, so Visual Studio attached itself as a debugger to the program. Alternatively, you can attach to a running process with Debug | Attach to Process… (Ctrl+Alt+P).
2. Debugger Break Mode
The debugged process has to be in “Break Mode” for debugging. That means the program is currently paused on a specific line of code. More accurately, all the running threads are paused on a specific line of code.
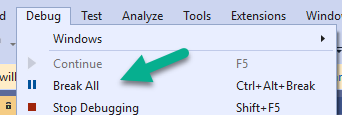
You can get to break mode with Debug | Break All menu item (Ctrl+Alt+Break) or by placing breakpoints.
We’re usually going to use breakpoints because in most debugging scenarios we will want to debug when the program reaches a certain line of code.
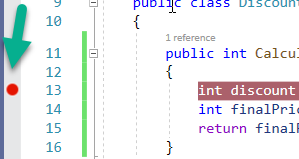
You can place breakpoints by clicking on the margin, pressing F9, or Debug | Toggle Breakpoint. Once set, when your program reaches that line of code, Visual Studio’s debugger will stop execution and enter “Break Mode”:
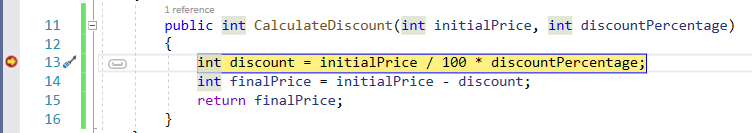
In break mode, the yellow line represents the next line of code to execute.
3. While in Break Mode – Navigate through code
When in break mode, you can debug interactively and see how your execution of code progresses. The basic features of code navigation are:
Continue (F5) will quit break mode and continue the program’s execution until the next breakpoint is hit, entering break-mode again.
Step Over (F10) will execute the current line and break on the next line of code.
Step Into (F11) is used when the next execution line is a method or a property. When clicked, the debugger will step into the method’s code first line. By default, properties are skipped. To enable stepping into property code go to Tools | Options | Debugging and uncheck Step over properties and operators.
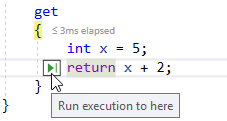
Run execution to here allows you to continue execution, and break in a specified location without a breakpoint. It’s like creating a breakpoint and removing it after first break. You can do it in 3 ways:
- Hover and click on the green arrow that appears on the start of each line
- Stand on the desired line of code and click Ctrl + F10
- Right click on the desired line of code and click on Set next statement
Run to a cursor location allows you to forcefully set the next line of code to execute. The current (yellow) line will not be executed. It can be a line that was executed before or after, but it’s best for the new line of code to stay in the current scope. There are 2 ways to do this:
- Drag the yellow arrow to any line of code
- Stand on the desired line of code and click Ctrl+Shift+F10
4. Investigate variables
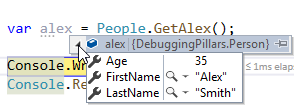
When in break mode, you can investigate the value of local variables and class members. This is as easy as hovering over a variable:
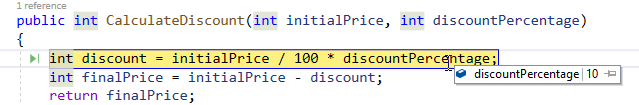
The hover popup is called a Data Tip. You can get to the same popup by right-clicking the variable and select QuickWatch (Shift+F9 or Ctrl+D, Q) in the context menu.
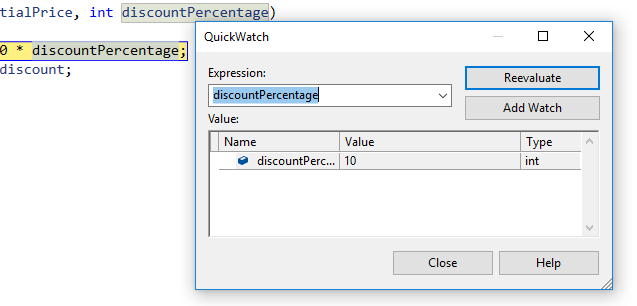
The data-tip and QuickWatch are very similar, except that you can edit the expression in QuickWatch.
An expression is a sequence of variables and operators that evaluate to a single value. For example, discountPercentage is an expression, initialPrice / 100 * discountPercentage is also an expression, literals like "Hello world" and 5 are also expressions.
For complex objects, you can expand into fields and properties.
5. DataTip and QuickWatch notable Features
The DataTip and QuickWatch have several useful features:
- Pinning DataTips – You can leave a DataTip pinned to the editor by clicking on the pin icon. Useful when you hit the same breakpoint many times (maybe in a loop)
![]()
- Holding Ctrl will make the DataTip transparent
- By right clicking on an expression in the DataTip, you can open a context menu with several options:
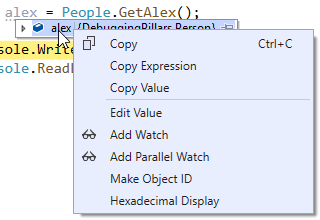
- Copy – Copies to clipboard both Expression and Value (
alex = {DebuggingPillars.Person}) - Copy Expression – Copies expression (
alex) - Copy Value – Copies expression (
{DebuggingPillars.Person}) - Edit Value – A useful feature where you can change the value during debugging. Most useful for primitives (strings, integers, etc.).
- Add Watch – Adds expression to Watch window (more on that later)
- Add Parallel Watch – Adds expression to Parallel Watch window (more on that later)
- Make Object ID – Creates a scope-independent expression that starts with ‘$’ (
$1,$2, and so on). You can evaluate this expression at any time, regardless of the current scope, in QuickWatch, Watch Window or the Immediate Window. A very useful feature and can be used to detect memory leaks .
6. Breakpoint advanced features
The breakpoints has several very useful lesser known features. By right-clicking a break you will see a context menu:
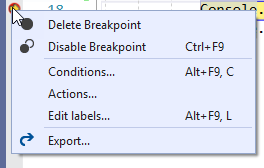
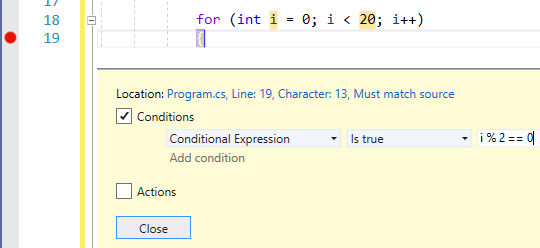
- Conditions allows you to break on this breakpoint only when a condition is met. For example, when in a loop I can break only on even numbers:
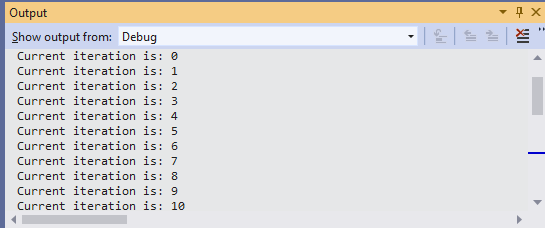
- Actions allow you to log a message to the output window whenever the breakpoint is hit. You can continue execution, without stopping on the breakpoint.
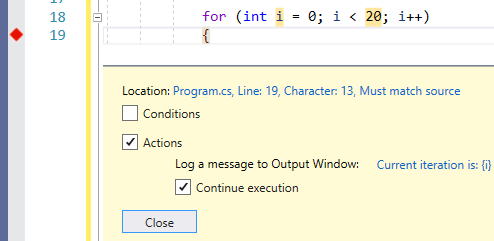
This is most useful when debugging multi-threaded scenarios. More on multi-threading debugging later.
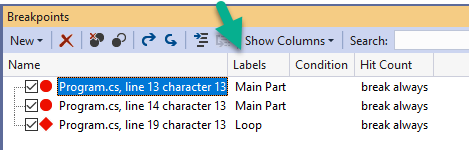
- Edit labels… allows to categorize breakpoints into labels. This makes it easier later to organize them in the breakpoints tool window:
Summary
We covered the very basics of Visual Studio debugging, so I hope you feel comfortable with the material because the next tutorial will be more advanced.
In the next tutorial we will dive into Visual Studio tool windows. These include: The immediate window, Watch windows, Locals, Autos, Call Stack, Threads, Breakpoints, Exceptions, and output window.
There are other tool windows as well, but they are not part of the basic debugging features and we will cover them in their relevant context. These include the Modules window, Processes, Tasks, Parallel Watch, Parallel Stacks, Disassembly, and Memory window.
New tutorials coming soon, so keep following .