Demystifying Memory Profilers in C# .NET Part 3: Memory Pressure
Memory and performance are tightly coupled to each other in .NET. If you don’t create a “garbage collector friendly” application, you’ll have performance problems. In extreme cases, those problem turn into memory pressure, also known as GC pressure. This situation occurs when the application spends too much time in garbage collection instead of executing application code.
In small, or even medium-sized applications, you might not notice this problem at all. You might have an ASP.NET server that processes requests in 100 milliseconds. Maybe that number could have been 20% faster, or even 50% faster, but it’s all the same when the response time is so small. Moreover, memory pressure issues usually manifest in high-load programs. So even if you potentially have big problems, if you have one request a minute, you won’t feel them at all.
The problems start in big applications and in scale. When your small server suddenly serves a million requests a day, every millisecond starts to matter. You might notice that 30% or 50% of execution time is spent in garbage collection. That’s serious memory pressure and it can cripple your application’s performance. 50% time in GC means you could have served close to twice as many requests.
In this article, you’ll understand what happens during memory pressure, find out how to detect it, see common causes for it, and discover how to use memory profilers to find the exact problem origin.
This article is part of a series. You can also check out part 1: Memory Profiler Principles and part 2: Memory Profilers and Memory Leaks .
Detecting a Memory Pressure problem
You should suspect GC pressure when you experience performance problems. This is a common cause for the more serious performance issues, the ones that really hurt. There are several easy ways to see if your performance issues are caused by GC pressure:
With Performance Counters – The most important counter to identify GC pressure is .NET CLR Memory | % Time in GC. It directly indicates time spent in garbage collection and not executing application code. From my experience, a good value will be 10% or lower, and certainly no more than 20%. Besides this counter, look closely at .NET CLR Memory | # generation 2 Collections. Those collections are called “Full GC collections”, which go over the entire managed memory of the process. They are very expensive and pause code execution in all threads for a relatively long time. When there is a high amount of gen 2 collections, the performance is impacted.
You can also look at the counter .NET CLR Memory | # Bytes in all Heaps. Unlike Private Bytes, this represents just the managed memory. If you see a pattern similar to the image below, then you have a memory pressure problem.
With Visual Studio Diagnostic Tools – If you’re debugging with Visual Studio, then there’s an easy way to detect both GC pressure and memory leaks just by looking at the Diagnostic Tools.
Here’s what GC pressure looks like:
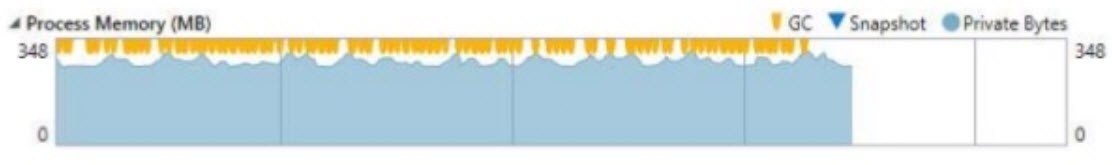
As you can see, the GC collections are very frequent, and the memory usage is moving around a small span. The allocations reduce the memory a little only to have it rise right back up.
In contrast, when you have memory leaks , the graph looks something like this:
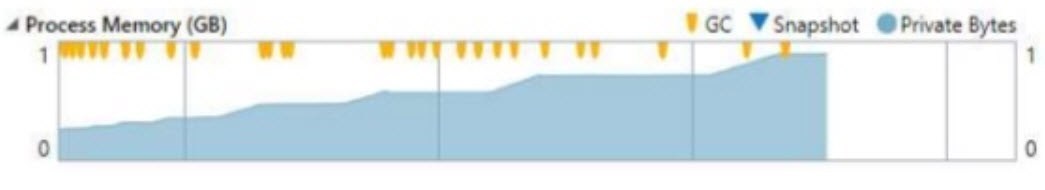
Here, the garbage collections don’t really reduce the memory back to its “normal” size even after you’ve finished an operation and returned to an idle state.
With a performance profiler – Since GC pressure manifests as a performance problem, it’s reasonable to start investigating with a performance profiler. Some profilers, like dotTrace, show the % Time in GC value for each method. One look at this indicator will tell you if it’s a GC pressure problem. Here’s an example of a problem I had in Ozcode (my day job):
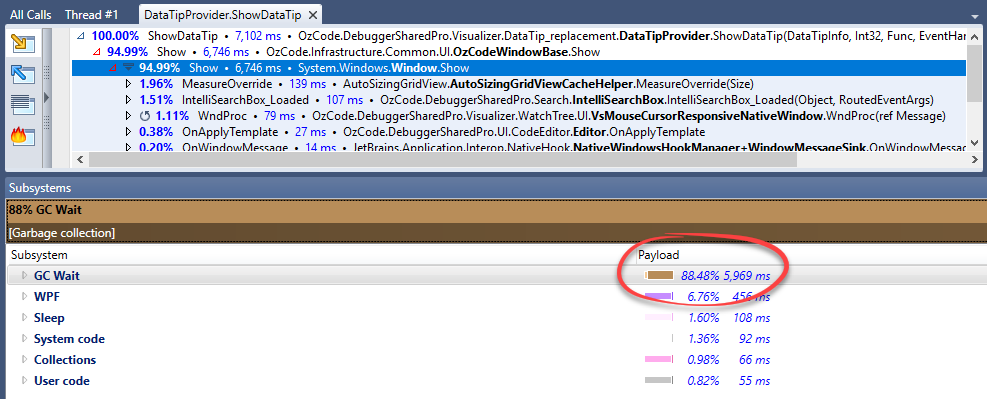
The GC Wait indicator here is almost at 90% during the method
ShowDataTip(), causing 6 seconds of delay. GC Wait is the same as the % Time in GC performance counter.
NOTE: Be careful of magic numbers like the ones I gave for a good % Time in GC value. Although I mentioned that under 20% is usually okay, this is very different according to the application type, its functionality, the CLR version, the operating system, the deployed machine, etc. The best policy is to strive for the lowest % Time in GC as possible and to monitor the normal GC pressure of your own application.
What Happens During GC Pressure
Garbage collections have different performance costs depending on the generation. Generation 0 collections are very cheap because they only go over objects in the generation 0 memory space, which is pretty small. Generation 1 collections are more expensive because they go over objects in generation 1 and generation 0. Generation 2 collections, which are also called full garbage collections, are considerably more expensive because they go over the entire memory space of all generations, including the large object heap.
GC pressure usually occurs when there are a lot of allocations of objects that live up to generation 2. This forces frequent generation 2 collections, and since these collections are extremely costly, the percentage of time the process spends in garbage collection shoots up.
The way to prevent this is to have fewer allocations and/or to have the temporary objects be collected sooner (before reaching generation 2).
NOTE: There’s another scenario where you might see the % Time in GC counter rising to a high number, and that’s due to the memory getting close to its limit. The memory limit for a 32-bit process is 4GB (out of which 2GB is reserved for the system). A 64-bit process’s limit is 8TB in theory, but the practical limit is set by the machine and the OS. When the used memory is close to its limit, even small allocations can trigger generation 2 collections.
The reason the memory gets close to its limit is either functional or due to memory leaks. If your application legitimately requires so much memory, then you’ll need to redesign things to expect to have decent performance. The more likely reason is memory leaks, in which case the GC pressure will be resolved as soon as the leaks resolve.
Common Scenarios Where Memory Pressure Occurs
Caching – Caching mechanisms are prone to cause GC pressure. You might have some sort of cache store to prevent repeating trips to the database or repeating calculations. Whenever a cache update is needed, a new object is allocated and the old object is freed. The problem with that is that cached objects usually live a long time (a long time here might be several seconds or minutes). This means they are likely to be promoted to generation 1 and generation 2. If the application utilizes that cache heavily, this will create GC pressure.
To solve this, instead of creating new objects whenever the cache is refreshed, update the old objects with the new value. This will change the system from an immutable one to mutable . Mutable objects are harder to work with in concurrent systems, so you should be very careful. If, for example, another thread uses that object during the cache update, it can cause a lot of trouble. The thread might use half of the fields from the old value, and the other half from the new value.
Immutable Systems – Any immutable system is prone to GC pressure because it encourages a lot of allocations in nature. One example is the Roslyn C# compiler, where everything is immutable. If, for example, you would add a line of code to your C# file, it will create a whole new document object with that line of code, copying all the lines of code from the previous document. So while immutable systems have many advantages, they are not very garbage collector friendly.
When threads are waiting for a lock to acquire or a request to finish – It’s common for web servers to perform database calls or network calls during a request. When you’re waiting for that database call or network call, all local variables are considered GC roots , and everything that they reference can’t be collected. This call might take a while, and during that time other threads are allocating new objects, which triggers garbage collections. Those garbage collections promote the waiting local variables and everything they reference to generation 1 and generation 2. As mentioned before, promoting temporary objects to higher generations causes GC pressure.
To mitigate this problem, you can set local variables that won’t be necessary after the database/network call to
null. This will allow the garbage collector to free them, and whatever they referenced because they will no longer be referenced by a GC root.
Fixing GC Pressure
When you detect a GC pressure issue, the next step is to find the root cause of the problem. The best way to do that is with a memory profiler. Here are the exact steps to investigate a GC pressure problem with dotMemory (although it’s similar in all memory profilers).
Start the application with the profiler (attaching to a process won’t work because there are Profiling API limitations when attaching).
Enable “Collect Allocations” (or “Include managed allocations” in SciTech’s profiler) to have the profiler save all memory allocations.
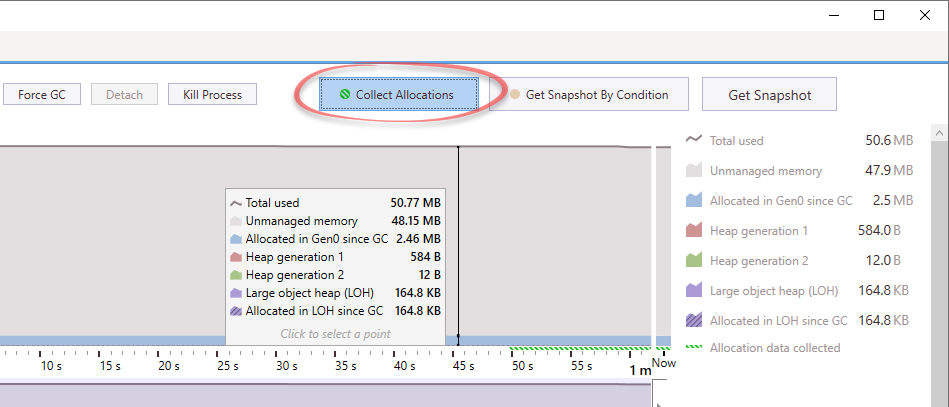
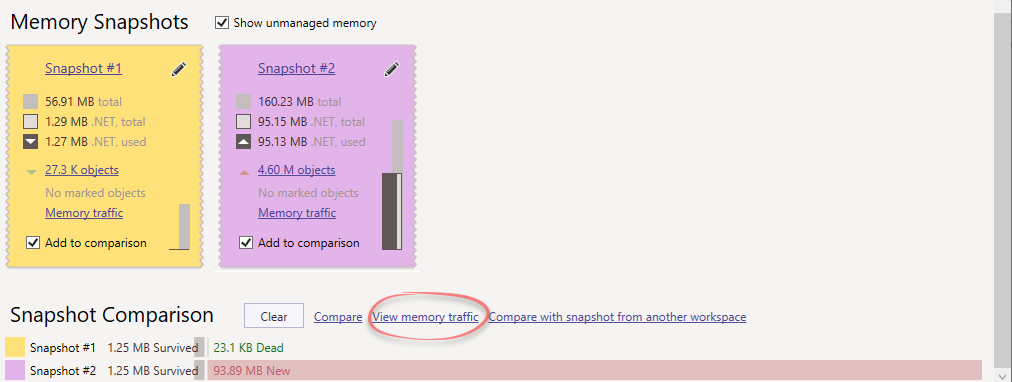
Take a snapshot.
Run the scenario where you experience GC pressure.
Take a second snapshot.
Compare memory traffic between those snapshots.
The memory traffic analysis will show the objects allocated in between those snapshots, as well as the collected objects. Both allocations and collections are important, and they will usually be the same type of object.
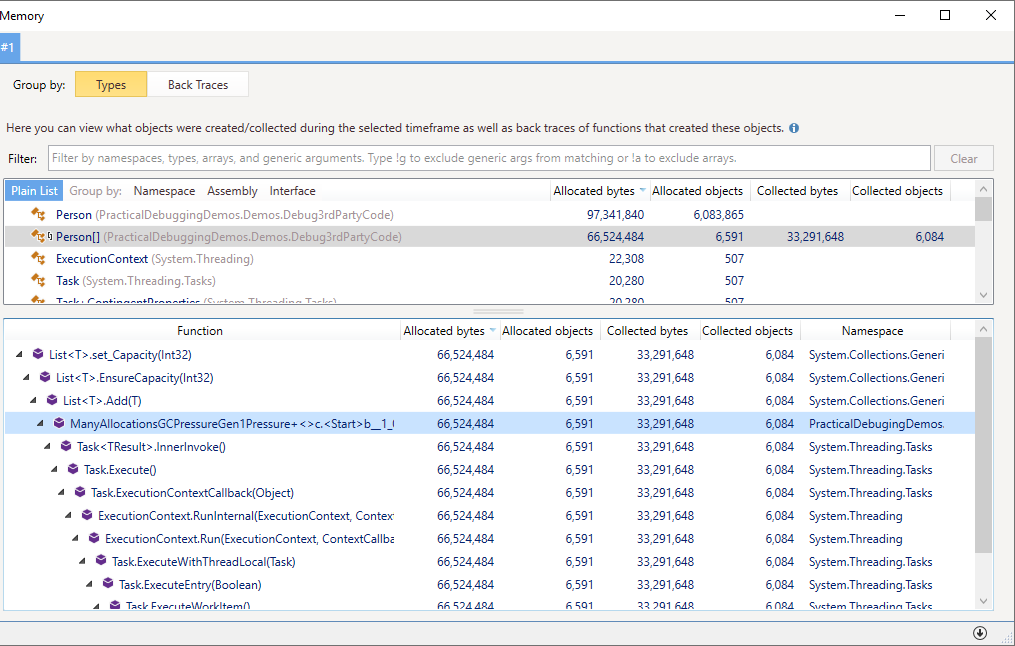
Here you can see that
PersonandPerson[]were the most commonly allocated and collected objects.Investigate the object types that were most commonly allocated and collected. It’s most likely that they are the ones causing the GC pressure. Look at the Back Traces of these objects (the bottom half of the figure), also known as the allocation call stacks. In there, you can find the methods that were responsible for these allocations, and that represents the root cause of the GC pressure.
Tip: Analyzing memory traffic (allocations and deallocations) as explained above is usually the best way to find the GC pressure root cause. But there are a few alternative techniques.
- Comparing Dead Objects – Instead of measuring memory traffic, you can compare two snapshots and observe the dead objects. Those are the objects that existed in the first snapshot and were collected by the time the second snapshot was captured. Sort according to size in bytes. The biggest objects are usually the ones causing the memory pressure. You can then analyze those instances and see if they were mostly in generation 2 memory space, which will prove or disprove that these objects reached generation 2 and caused expensive garbage collections.
- Peak Snapshots – If you have a professional or enterprise license to SciTech’s memory profiler , then you can use their Peak Snapshots feature. It captures a snapshot at the point at which memory usage is at its highest when a full garbage collection happens. At that point, it adds information about the collected instances and bytes. Viewing the objects with the largest collected bytes usually shows you the objects causing the most memory pressure.
What to Do Once The Root Cause is Found?
Now that you found the allocations that are causing the most memory pressure, there are two ways to relieve the pressure. Either have fewer allocations or have those objects collected sooner (before reaching generation 2).
The solutions are usually individual to each use case, but there are some common techniques to alleviate GC pressure. They involve these concepts:
- Reuse memory instead of allocating new objects.
- Allocate on the Stack instead of on the Heap.
- Avoid Finalizers. Objects with finalizers are promoted at least one additional generation.
- Change an immutable system to a mutable system by changing the states of objects instead of creating them. But be careful.
- Set unnecessary local variables to
nullbefore a database call or a network request.
To read more about those techniques, check out my article: 8 Techniques to Avoid GC Pressure and Improve Performance in C# .NET .
Memory Profiler Series Summary
This article concludes my memory profiler series. Here’s a small recap of everything learned:
Part 1: Memory Profiler Principles
- Popular memory profilers in .NET are: SciTech’s .NET Memory Profiler , dotMemory , ANTS Memory Profiler , PerfView , and Visual Studio’s built-in profiler .
- Profilers can start a .NET process, attach to a running process, or import dump files. Some profilers have a command-line agent for profiling in production.
- Profilers use the Profiling API under the hood, except for PerfView which uses ETW events.
- Memory profilers show a real-time view with information on memory consumption, allocations, and collections.
- Memory profilers can capture memory snapshots. Analyzing those snapshots shows all objects in memory, their size and count, who they reference, who references them, and the shortest paths to root.
- Memory leaks are a huge issue in big applications and they can be easily caused.
- You should suspect memory leaks when the application’s memory is constantly rising without going back to the normal size.
- Memory profilers can be used to find the leaky objects and they show exactly why these objects remain referenced.
- To find memory leaks, compare two snapshots when the application is in an idle state. If a memory leak happened in between those snapshots, the memory profiler will show it.
Part 3:
- Memory issues can cause huge performance problems. This is called memory pressure, or GC pressure.
- You can easily detect GC pressure with performance counters and performance (not memory) profilers.
- GC pressure usually occurs when there are a lot of allocations of objects that live up to generation 2.
- Memory profilers can record allocations and collections, and show the root cause of the GC pressure.
- Once you find the source of the pressure, try to reduce allocations. Or to have those objects collected sooner (before reaching generation 2).
Memory profilers are extremely useful, but they aren’t the only category of tools for .NET troubleshooting. We also have various debuggers, decompilers, performance profilers, and many others. If you’re interested in the subject, I suggest starting with my article on performance counters . I’m going to start another series about performance profilers, so subscribe to new blog posts and be the first to be notified. Cheers.