How to Create, Use, and Debug .NET application Crash Dumps in 2019

One of the most useful tools in .NET troubleshooting is Dump Files. This is probably the best tool to debug Crashes and for production-debugging. The expertise to create and investigate dumps well can be a huge asset to any organization.
In this article, we’ll see what exactly are dump files, why they are so helpful and how to use them correctly. You will see all the ways to create Dump files, to properly match them with symbols and source files and finally how to debug them to solve the problem.
While Dumps can be used both for native and managed programs, this article refers only to Managed .NET programs.
Table of contents:
- What are Dump Files?
- Dump Types
- How to Create/Capture a Dump
- Debug Dumps
- WinDbg Preview
- .NET Core Dumps
- Summary
What are Dump Files in .NET?
Memory Dump Files (.dmp files) are a snapshot of a program’s memory at a given time, like during a crash. With a dump file, you can see the current executing lines of code, the values of local values and values of all the heap objects. In other words, a dump file represents the entire state of the program at the point it was captured.
Dumps are usually used to debug crashes (Crash Dumps), but there are other uses as well. From most common to least they are:
- Debug crashed programs
- Debug hung programs
- Find memory leaks
- Debugging on a different machine or at a different time
- Debug programs that can’t be attached with a debugger
- Debugging with WinDbg
Dump Types
There are 2 dump file types: Full Memory Dump and Minidump. A Full Memory Dump contains the entire memory of the program, as advertised. It can become very large.
A minidump has a misleading name. It is a configurable dump format. It can contain the entire memory, taking as much space as a full memory dump (and even more), or it can include only part of the memory per configuration. (source )
For .NET, we will mostly use Dumps with the entire memory for a complete debugging experience. It can be both a full memory dump or a minidump configured to include the entire memory space.
How to Create/Capture a Dump
There are many ways to create a Dump. I’ll show some of the more common and recommended ones:
1. With Visual Studio while debugging
While debugging, go to Debug | Save Dump As…
This will save a minidump with Heap, which includes the full memory space.
2. With Task Manager
Open the Task Manager, go to Details, right-click the desired process and choose Create dump file.
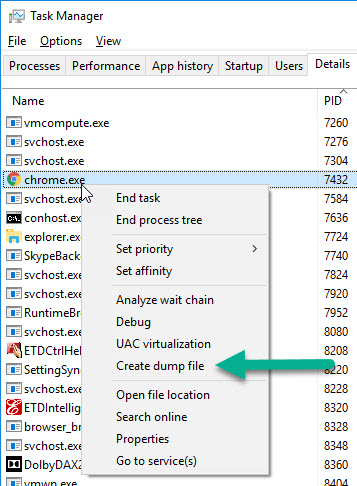
This will create a full memory dump.
3. With ProcDump
ProcDump
is part of the
A simple use case to immediately create a dump with full memory is:
<pre class="wp-block-code">```
procdump -ma [process ID]
procdump -ma [name of executable, for example "notepad"]
This creates a dump file in your working directory named: [process name]_[date]_[time].dmp.
You can monitor for things like memory usage, hung programs, CPU usage, first-chance exceptions and create a dump on demand. For example, this captures a dump when myprogram.exe is hung to a file named
<pre class="wp-block-code">```
procdump -h myprogram.exe dumpfile.dmp
Info on all the features is here .
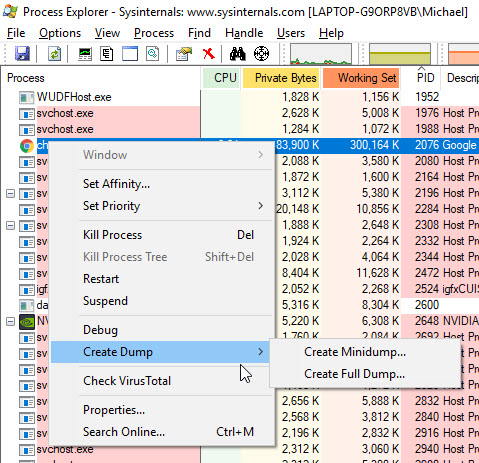
4. With Process Explorer
Process Explorer is another tool from the SysInternal toolkit. It’s like Task Manager on steroids. You can find which processes loaded a certain DLL or a Handle, see active Threads, registry keys and create dumps of course.
Right-click on any process and choose Create Dump | Create Full Dump…
5. Automatically create dump on Crash
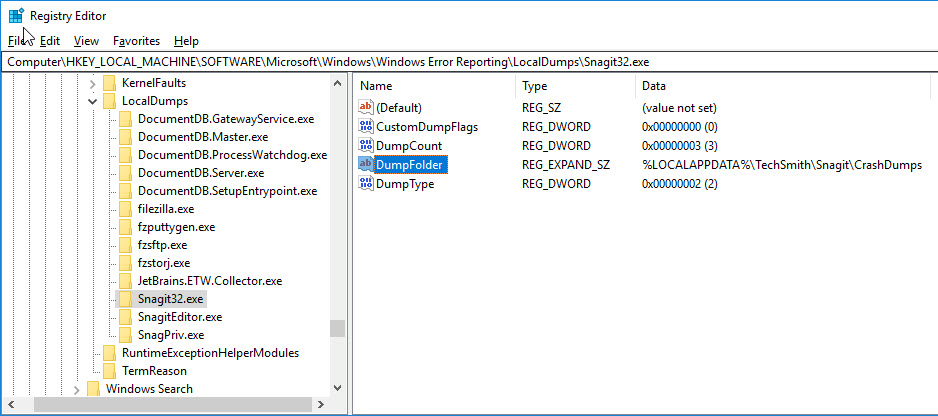
You can have Windows automatically generate dump files on program crash. This is done with Windows Error Reporting (WER). You can configure this in the registry:
- Run regedit.exe
- Open or create the key HKEY_LOCAL_MACHINE\SOFTWARE\Microsoft\Windows\Windows Error Reporting\LocalDumps
- Add a key with the same name as your program
executebale . For example, notepad.exe. - Add keys:
- DumpFolder (REG_EXPAND_SZ) – Folder where dump should be created
- DumpCount (REG_DWORD) – Maximum dumps created before old dumps will be overwritten. The default is 10.
- DumpType (REG_DWORD) – Minidump (1) or Full dump (2). Use Full dump for .NET.
The registry should look like this:
Debug Dumps
Creating Dumps is the easy part. The real challenge is Debugging them and understanding the problem.
There are several ways to debug a Dump file:
1. With Visual Studio
Probably the easiest way is to open the Dump File (.dmp) in Visual Studio. Assuming you can match the Symbols (.pdb files) and Source Files, you’ll have a full debugging experience. That is, you’ll see the code like you’re standing on a breakpoint. If it was a Crash Dump, then you’ll see the Exception that caused the crash. You should also see Threads, Call Stacks, locals, loaded modules and so on.
Instructions to debug with Visual Studio:
- Open the .dmp file in Visual Studio
- Press on “Debug with Managed Only” or “Debug with Mixed”
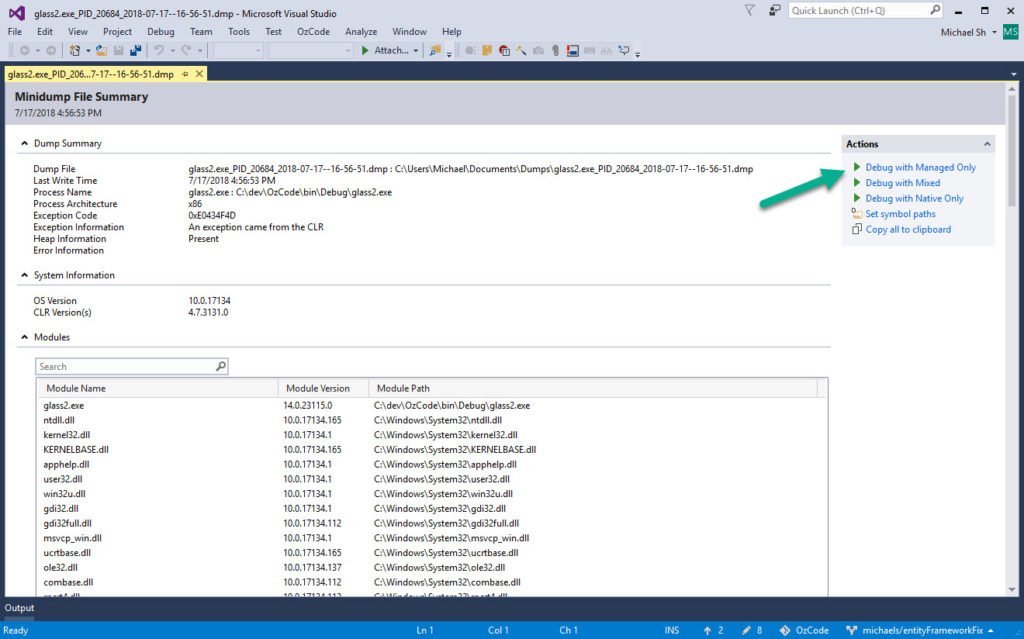
- Wait for VS to try and load symbols and match to the source code.
- If symbols were loaded, you will see the code. Otherwise, you should see the call stack, exception information (if captured on exception), and possibly local values.
- Investigate the exception or problem like in regular visual studio debugging.
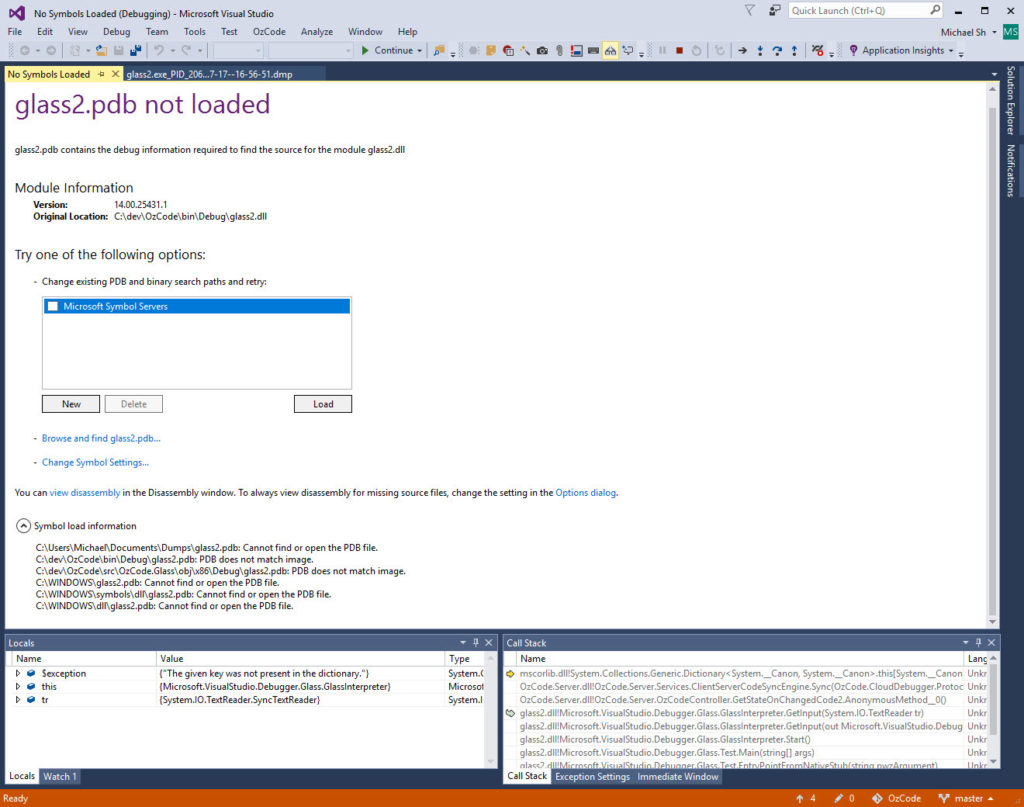
Matching Symbols and source code files to the Dump in Visual Studio
In the last
By loading the symbol files, you can also see the code right in Visual Studio. For that, you will need both the .pdb files and the actual source files. The symbols (.pdb files) are created in your bin\Debug or bin\Release directory by default after each build, alongside your assemblies (.exe and .dll files). It’s recommended to deploy your program / NuGet with the symbols included.
It’s important to understand that the symbols and source code should exactly match the same version as when the Dump was created. Otherwise, the matching will fail.
Visual Studio tries to find the Symbol files by itself. It looks in:
- The directory where the executable was built into (your bin\debug or bin\release)
- The directory of the opened .dmp file
- Symbol directories, which can be configured in Tools | Debugging | Symbols.
- Symbol servers
So to load the symbols, you’ll just need to place them in one of the above directories. You can also load individual symbols manually from Visual Studio (like from Modules Window).
If you have the assemblies (.exe and .dll), then you can decompile them for source code and extract their symbols. Programs like dotPeek can extract symbols + source code and act as a Symbol Server . Then, you can add that symbols server in Visual Studio’s Tools | Debugging | Symbols.
There are two technologies to automatically get the source code from the .pdb files: Source Server and the newer Source Link . I never used them, but I believe Source Link embeds a link to the correct git commit with the relevant source code version.
2. Investigate Dumps with WinDbg
WinDbg is considered the go-to tool for investigating Dump files. Nowadays, I wouldn’t recommend it for simple cases, where you can open the Dump in Visual Studio and get the same information in a graphical IDE.
Having said that, Visuals Studio is still playing catch-up in terms of abilities. WinDbg can explore the object heap, extract modules, [find deadlocks](s /how-to-debug-net-deadlocks-c-deadlocks-in-depth-part-3/) and do a whole lot of things VS still can’t.
If you’re not familiar with WinDbg, it’s a (mostly) command line debugging tool for Windows. WinDbg can be used for native programs or for managed .NET programs with the SOS debugging extension .
To get started with WinDbg:
- Install WinDbg with Debugging Tools for Windows .
- Open the correct WinDbg version – There are x86 and x64 windbg.exe executables, they should match the Dump’s bitness. Look in these folders:
C:\Program Files (x86)\Windows Kits\10\Debuggers\x64
C:\Program Files (x86)\Windows Kits\10\Debuggers\x86 - In WinDbg, open your saved Dump (Ctrl + D)
- Enable verbose symbol logging with
!sym noisy - Set Symbol search paths with
.sympath srv*https://msdl.microsoft.com/download/symbols
.sympath+ cache*C:\debug\symbols
.sympath+ C:\MyApp\bin\Debug - Force reload Symbols
.reload
ld* - Load the SOS extension
.loadby sos clr - Continue with other commands
As shown in instruction #5, you can load symbols from any directory or symbol server if you have them. In that aspect, it’s similar to Visual Studio.
In WinDbg, there’s also the matter
So what can you do with WinDbg?
Whatever you can do with Visual Studio, you can also do with WinDbg and more. Here are some stuff you can do with WinDbg that you can’t do with VS:
- Explore Object Heap (by Type, Memory Consumption)
- Search object Heap by
string - View thread CPU consumption
- View (more detailed) information about an object (Method Table, EEClass, size, fields…)
- View memory consumption (by Type, for objects of Type X,..)
- Show all locked objects
- See lock count on each thread
- Automatically detect deadlocks (SOSEX)
- Explore Garbage Collector – content of generations, in finalizer queue,…
- Extract modules (useful if you have Dump only, to decompile from and create symbol server)
- More…
I might have missed some or added something that Visual Studio can do as well, VS keeps getting better. But the general idea is that WinDbg can do almost anything, though it might be a little difficult to handle. Here’s a cheat sheet on WinDbg commands for managed Dump. This includes commands with SOSEX , another useful extension for WinDbg managed debugging.
3. Debug Dumps with other Tools: CDB & NTSD, DumpMiner, and SuperDump
There are some other tools for Dump files debugging:
- CDB and NTSD are command line debuggers similar to WinDbg. The difference is that CDB has no UI at all, whereas WinDbg does have some UI like memory address links.
- DumpMiner is a tool to debug Dumps using the ClrMD library. It gives a lot of WinDbg abilities in a user-friendly UI. It can investigate Call Stacks, Threads, Large Object Heap, Finalizers, Handlers and more.
- SuperDump – Also allows WinDbg-like abilities in a user-friendly matter. It’s a cloud-based solution so you’ll have to upload your Dump to their server to use it. SuperDump is packed with a lot of features .
WinDbg Preview
We talked a lot about WinDbg in this article and all the examples were shown in the classic WinDbg version. However, there’s a new version of WinDbg that was released in August 2017. It’s now known as WinDbg Preview.
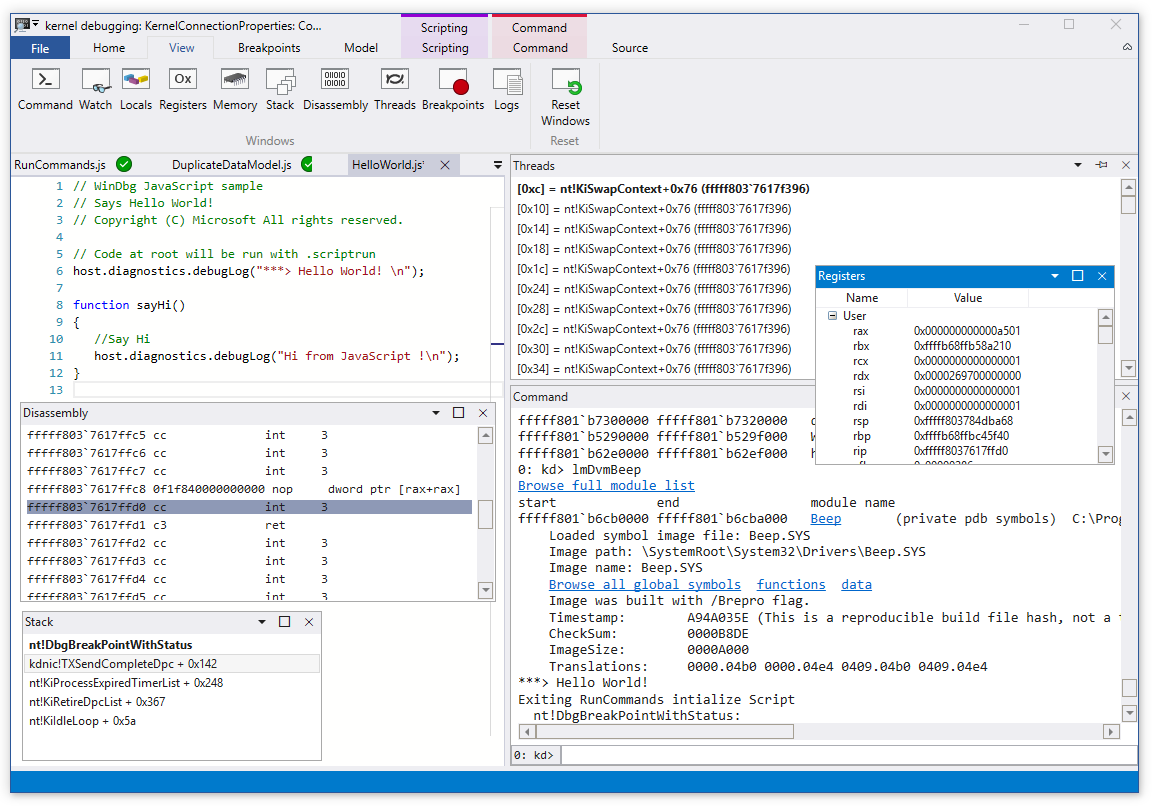
The new version is still command line based, but it includes a lot of visualizations, highlighting, keyboard shortcuts, debugging windows and new features . Don’t know if it’s ever going to be as nice as debugging in Visual Studio but it’s certainly a step in the right direction.
.NET Core Dumps
As far as .NET Core is concerned, everything works as well as in .NET framework. You can open .NET Core Dumps both in Visual Studio (2017) and in WinDbg. The only difference
in WinDbg is you’ll have to load SOS
It’s even possible to debug .NET Core dumps in Linux (see article by Sasha Goldshtein).
Summary
As you read in this article, Debugging Dumps is no longer automatically going to WinDbg. In 2019 we have many tools at our disposal that can make the debugging job much easier. Some of those tools are Visual Studio, DumpMiner , SuperDump , and WinDbg Preview .
Crash Dumps was always a scary thing for me. Along the years, I become more familiar with them and slowly they became less scary and more friendly. So I hope this article helped you to make better friends with Dump Files.