How to debug .NET Deadlocks (C# Deadlocks in Depth - Part 3)

Welcome to the 3rd and final part of the Deadlocks-in-Depth series. In this part, I’ll show you 2 additional techniques to debug deadlocks: Working with Tracepoints and using the notorious WinDbg to automatically detect deadlocks.
If you’ve stumbled on this post in an attempt to debug deadlocks, you’re in the right place. But I suggest first reading Part 1 and Part 2 . You will see common deadlock causes, techniques to debug them and the ways to solve them. But, reading this part as a standalone bit is perfectly fine as well.
Debugging Threads with Tracepoints
Tracepoints are one of my favorite debugging technique for multi-threaded scenarios. They allow you to set breakpoints that don’t stop the execution. Instead, they print a message to the Output Window. This is extremely useful since printing those in the order they came in, helps to understand the scenario much better.
To create a Tracepoint with Visual Studio, do the following:
- Set a regular breakpoint
- Right-click on the breakpoint, and select Actions…
- Fill whatever you want to print to the output window. You can print variable values as well.
Here’s me debugging the Nested-Lock deadlock from Part 1 (fast-forward on the boring parts).
In a small program, it works fine enough, but in a bigger problem the Output Window is clattered and your debugging experience is not as great. OzCode Visual Studio extension offers a much better Tracepoint experience. Here’s the same scenario using OzCode:
OzCode has a few more Tracepoint features and provides an overall better debugging experience.
Full Disclosure: I am currently an OzCode employee. This is my personal blog though and it’s my own professional recommendation.
Automatically detect Deadlocks with WinDbg
WinDbg is a hardcore command-line debugging tool for Windows. It’s hardcore because it’s both very powerful and difficult. Modern .NET tools like Visual Studio’s debugger and various profilers are infinitely easier to get started with and use than WinDbg. However, in some cases, you are stuck with WinDbg. And sometimes, it just offers better functionality.
WinDbg can be used for native C++ programs or for managed .NET programs with the SOS debugging extension . I’ll show you how to use WinDbg to debug the Nested-Lock deadlock from Part 1 . We’ll use an additional extension called SOSEX , which allows to automatically find deadlocks.
Here are the steps to take to debug with WinDbg:
1. Create a memory dump of your hanged program
A memory dump is a “snapshot” of the current program memory. With the Dump and Symbols (.pdb files), you can get a full debug experience in Visual Studio or WinDbg, even on a different machine. There are several ways
to create a Dump. I used Windows
2. Install WinDbg
You can install WinDbg with Debugging Tools for Windows . You might already have it though – look for the windbg.exe file on your PC.
3. Add SOSEX to WinDbg
Download the SOSEX extension from here , extract the content and place it in the same folder as windbg.exe. (There are 2 versions – for x86 and x64)
4. Load your Dump in WinDbg
I suggest following this guide that shows this process with nice screenshots. Or following my instructions, which are virtually the same:
- Look for WinDbg.exe on your PC. It might be in those folders:
C:\Program Files (x86)\Windows Kits\10\Debuggers\x64
C:\Program Files (x86)\Windows Kits\10\Debuggers\x86 - Open the relevant WinDbg.exe that matches your program platform
- In WinDbg, open your saved Dump (Ctrl + D)
- Enable verbose symbol logging with
!sym noisy - Set Symbol search paths with
.sympath srv*https://msdl.microsoft.com/download/symbols
.sympath+ cache*C:\debug\symbols
.sympath+ C:\MyApp\bin\Debug - Force reload Symbols
.reload
ld* - Load the SOS extension
.loadby sos clr - Load the SOSEX extension
.load sosex
The first time you do this, MS symbols will load to your cache folder, which can take a while (15 minutes maybe).
5. Find the Deadlock
Now that your Dump is loaded, you can experiment with some of WinDbg’s command. Interesting commands are:
!threads //shows all threads
!mk //sosex command that shows threads with locals and parameters
!clrstack //shows stack of current thread
~[threadid]s //changes thread. For example: ~5s
!dlk //the magic command that shows deadlocks
So back to our scenario. As you remember, I created a dump from the Nested-Lock deadlock code, which was this:
public void Foo()
{
    object lock1 = new object();
    object lock2 = new object();
    Console.WriteLine("Starting...");
    var task1 = Task.Run(() =>
    {
        lock (lock1)
        {
            Thread.Sleep(1000);
            lock (lock2)
            {
                Console.WriteLine("Finished Thread 1");
            }
        }
    });

    var task2 = Task.Run(() =>
    {
        lock (lock2)
        {
            Thread.Sleep(1000);
            lock (lock1)
            {
                Console.WriteLine("Finished Thread 2");
            }
        }
    });

    Task.WaitAll(task1, task2);
    Console.WriteLine("Finished...");
}
Now let’s debug this in WinDbg. First, we can call !threads to get the first impression of the managed Threads at the moment this Dump was created:
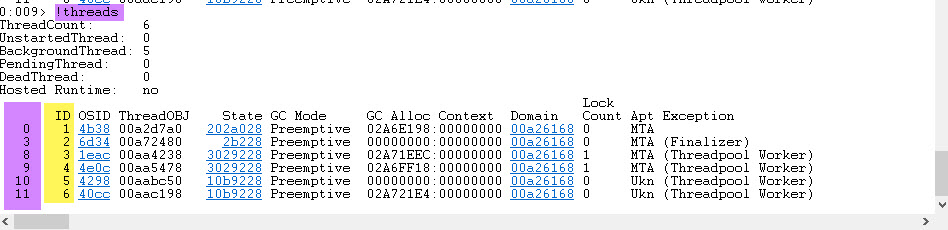
On the left side, you can see each thread has 2 IDs. The leftmost is the native ID, and the rightmost is the managed ID (CLR Thread ID).
We can see that 2 Threads have Lock Count of 1, which is suspicious. Now let’s use the magic command !dlk to find the deadlock
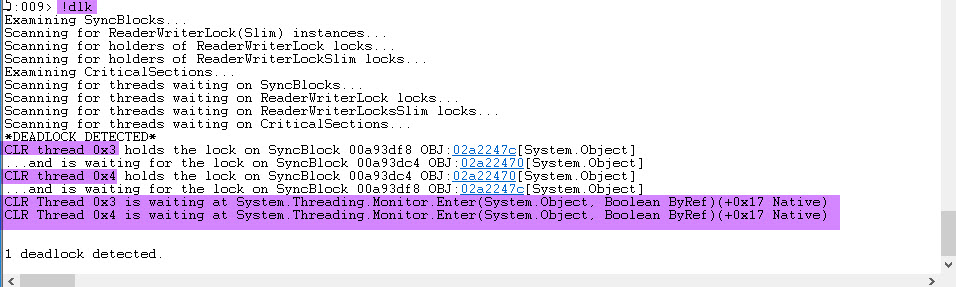
As you can see, CLR Threads 0x3 and 0x4 are in a deadlock.
0x3 and 0x4 are the managed thread ID. If you look in the !threads output in the first screenshot, we can find the relevant native thread ID, which

And the same for the other Thread:

There you go – confirmation a deadlock exists and the call stacks of the deadlocked Threads.
Don’t know about you, but using a command-line debugger makes me feel smart.
Don’t be fooled by the easy example though. WinDbg is hard. The initial step of matching the Symbols, matching the correct bitness (x86, x64) and loading the correct DAC (mscordacwks.dll) can be a pain. Then, the debugging process is hard by itself. Every single thing requires several commands, and the textual data is much harder to understand than an IDE debugger.
Note that
Use Performance tracing to detect deadlocks
Another possible way to easily get an overview of a deadlock is to record a snapshot with a performance profiler like dotTrace . On a deadlock, Threads get “stuck” on a statement, like when trying to acquire a lock.
Recording a performance trace (snapshot) allows you to see all the function calls. So just by looking at the calls that took the longest time, you can usually easily detect the stuck Threads. And from there, see the calling stack and understand the scenario.
Here’s a snapshot example we encountered in OzCode :
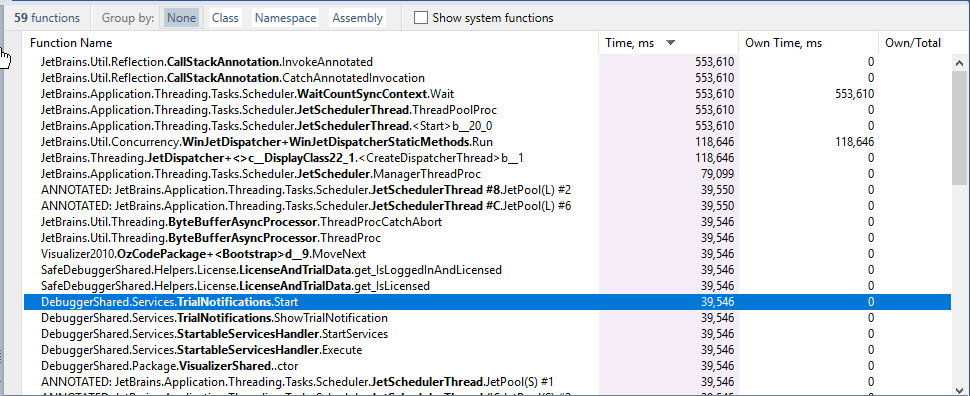
As you can see, a lot of the methods took 40 seconds. Other methods are a multiplication of that time, which means they might be in the call stack of several of the deadlocked Threads, or waiting for them to finish for some reason.
Summary
This is it, my Deadlocks-in-Depth series is finished. I’ll probably remember this fondly in 10 years or so.
We saw a whole bunch of deadlocks, a lot of ways to solve them and several techniques to debug them. Here’s a recap of the debugging techniques for deadlocks:
- Use the Threads Window in Visual Studio to go over all the Threads and see if they are standing on
suspicious code, like waiting for a lock to release. (from Part 1 ) - Use the Tasks Window when working with Tasks to automatically detect deadlocks. (from Part 2 )
- When not running from Visual Studio, extracting memory Dumps is the best way to examine the deadlock. (assuming attaching Visual Studio Debugger to the process isn’t possible).
The Dump file, along with Symbols (.pdb files) can be opened on any machine with Visual Studio or WinDbg to debug and find the deadlocks. - Use Tracepoints to debug multi-threaded scenarios and deadlocks.
- WinDbg can automatically detect deadlocks from memory dumps, using SOS and SOSEX extensions. But it works only for deadlocks caused by SyncBlock or ReaderWriterLock.
This is a pretty complicated subject and there was a lot to cover. But, on the way, I learned much more (and hopefully you did too!) about locks, async/await mechanism, Synchronization Context, the UI Dispatcher and even WinDbg.
I probably missed some important tips, so if you have anything to add, please leave a comment.
Check out my other articles on C#, some of them are halfway decent. And if you’re interested in updates on new ones, please subscribe to the blog.