One of the reasons modern computers are so fast is because of multi-core processors. New CPUs can execute many instructions in parallel. How many? As many as the number of logical CPU cores. This allows us, programmers, to run code in parallel using Threads.
While this is great, it presents problems like race conditions and resource access from multiple threads. Locks provide a solution to some of those problems but add a new set of problems like Deadlocks and Lock contention.
Deadlocks is a state where two or more threads are stuck indefinitely waiting for each other. This is technically a freeze and not a performance problem. I’ve got a great 3-part series on deadlocks available here .
In this article, we’re going to talk about Lock contention, which is a state where one thread is waiting for another while trying to acquire a lock. Whatever time spent waiting for the lock is “lost” time that is wasted doing nothing. This can obviously cause major performance problems. In this article, you will see how to detect lock contention problems, debug them with various tools and find the core cause of the issue.
Lock contentions can be caused by any type of thread-synchronization mechanism. It might be because of a lock statement, an AutoResetEvent/ManualResetEvent, ReaderWriterLockSlim, Mutex, or Semaphore and all the others. Anything that causes one thread to halt execution until another thread’s signal can cause lock contention.
Performance Profiling
Let’s say you’re debugging slowness in a particular operation triggered by a button click. It might be a desktop application or a web app, it doesn’t matter. If possible, a performance investigation should start with a performance profiling tool like ANTS performance profiler or dotTrace . They allow you to record a runtime span (snapshot) and analyze it for performance issues. You’ll be able to see how much time each method took, which call stacks executed the most time, type of code that took the most time and more.
Here’s how a 10 seconds lock-contention wait looks like after profiling in dotTrace with Sampling mode:

You can see above that the method ThreadOperation spent almost 10 seconds in Monitor.Enter. Which means it was stuck on a lock statement all that time. Looking at the code that caused this, you can guess how this happened:
public void Start()
{
    object mylock = new object();

    var task1 = Task.Run(() => { ThreadOperation(mylock, "Thread A"); });
    var task2 = Task.Run(() => { ThreadOperation(mylock, "Thread B"); });
    Task.WhenAll(task1, task2).ContinueWith((t) =>
    {
        Console.WriteLine("Finished");
    });
}

private void ThreadOperation(object mylock, string threadName)
{
    for (int i = 0; i < 10; i++)
    {
        lock (mylock)
        {
            Console.WriteLine($"{threadName} is running iteration {i}");
            Thread.Sleep(5000);
        }
    }
}
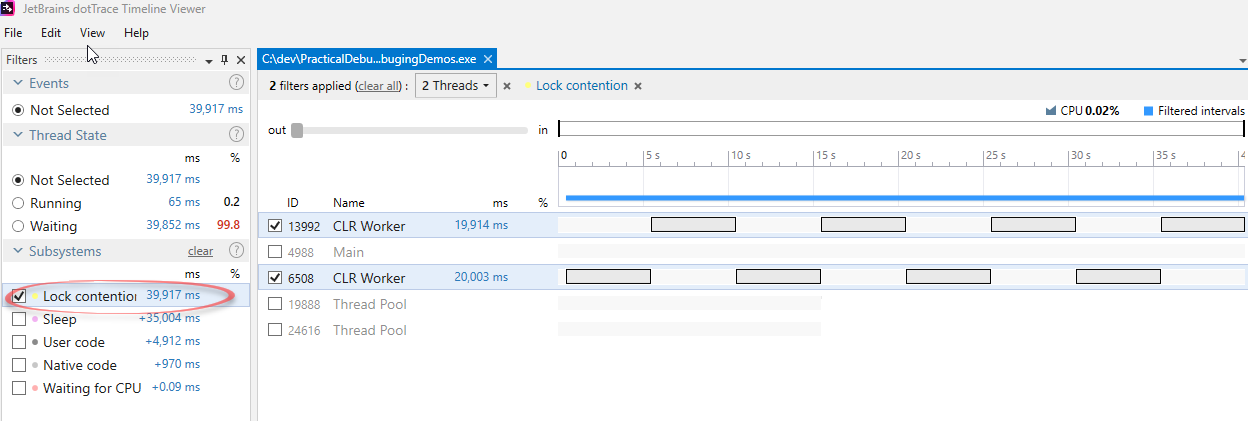
If regular profiling wasn’t enough, one of the best ways to see time lost to lock contention is with dotTrace’s Timeline Profiling mode (the previous screenshot was with Sampling mode). It shows time lost to threads waiting for locks at first glance:

Not only do you see how much time was lost to Lock contention, you can clearly see the problematic threads and a chronological view of the time spent waiting.
Debugging With Performance Counters
One of the best ways to start investigating performance issues is with Performance Counters . It’s a built-in mechanism in Windows that allows you to capture a bunch of metrics related to CPU, Memory, I/O Operations, Exceptions, Lock Contention and many others.
One of the most important counters to look at during performance investigations is Process | % Processor Time. It shows CPU usage for the entire machine or a specific process. If the Processor Time is rising during the slowness, then the root cause is a CPU-bound operation. If the Processor Time is not rising, then the issue is something else, like Lock Contention. Note that this number reaches up to 100 * [number of logical CPUs]. So when you see 100% value, it doesn’t mean all CPU cores maxed out.
Now that you found that it’s not a CPU issue, you can look at the .NET CLR LocksAndThreads | Contention Rate/sec. This counter shows lock contentions count per second. The problem is that each lock contention is considered as 1, no matter if the thread waited a nanosecond or a minute. Still, a big number of contentions is a bad sign and should be investigated.
There are a few ways to consume performance counters:
- In Windows, you can use a tool called PerfMon, which is included with a Windows installation. Read more about it in Use Performance Counters in .NET to measure Memory, CPU, and Everything
- In Azure, you can view performance counters with application insights and with Azure Diagnostics .
- In .NET Core 3+ applications, you can now use a cross-platform command-line tool called dotnet-counters . This is a great improvement considering there wasn’t any good way to consume perf counters on Linux up to now.
Debugging with Visual Studio
Once you are convinced that lock contention is the cause of your performance problem, you’ll need to find the code responsible. You’ll want the call stack of the code that holds the lock and the call stack of threads that are trying to acquire it. An easy way to get to those call stacks is with an interactive debugger like Visual Studio or WinDbg. This should be done either by attaching to a process and going into Break Mode or by opening a Memory Dump .
If you succeed in breaking execution during the lock contention, go to Threads Window and manually go over the threads. Eventually, you’ll find a thread stuck on a lock statement, a WaitOne() statement, Monitor.Enter()or something similar. This shows the threads waiting to acquire a lock.
Another approach is to go to the Debug | Windows | Tasks window, which will show the waiting Tasks:

This works only with threads created with the Task API. It won’t work with threads created by new Thread or by ThreadPool.QueueUserWorkItem.
Debugging With WinDbg
WinDbg is useful in many cases, one of which is production debugging. It’s a relatively lightweight tool, which you can copy to a production machine, capture a Dump file, and debug it right there. With NTSD, WinDbg’s command-line equivalent, you can even use it on a machine where you have only command-line access. Like on an Azure App Service.
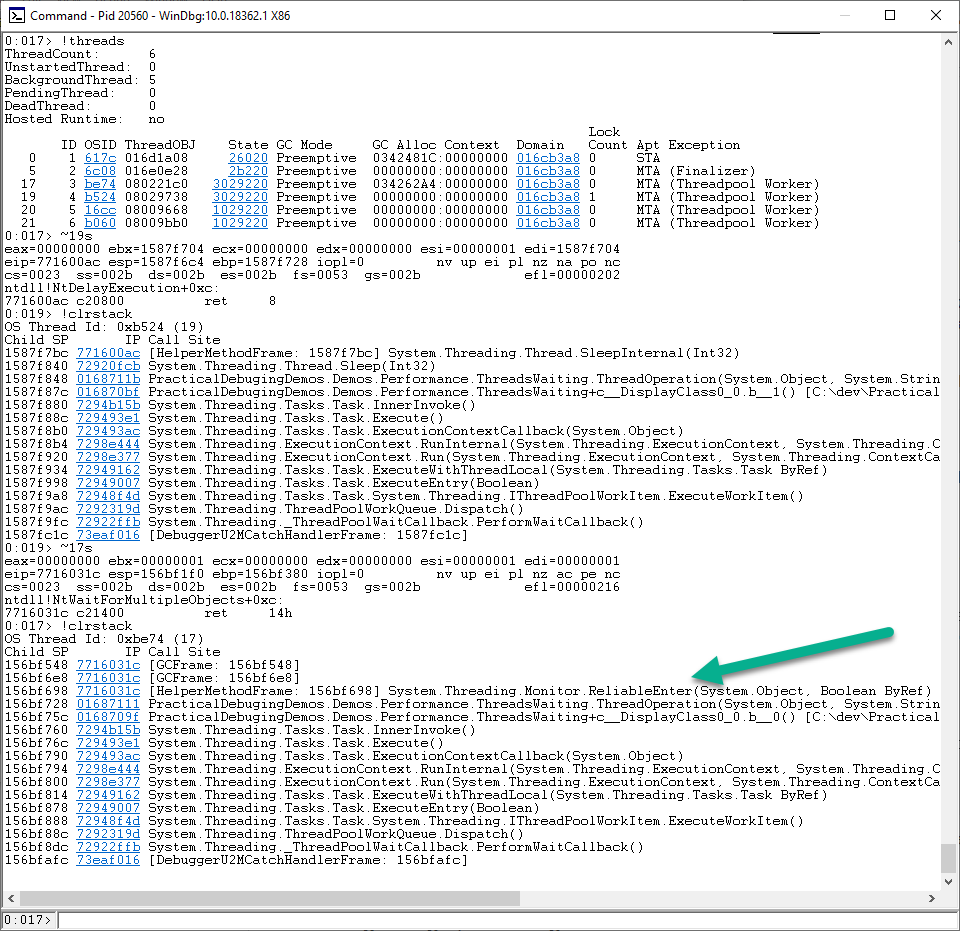
You can use WinDbg to find the threads that hold the lock. Use the !threads command first to see all threads and Lock Count. Then, move to the thread with a lock count higher than 0 with ~[native_thread_id]s. For example, ~3s. Then, use !clrstack to view its call stack.

As you can see, thread 19 is holding onto the lock and thread 17 is waiting to acquire it with Monitor.ReliableEnter.
You can also make use of the !syncblk command. It will show all locked objects, which threads own them and how many threads are waiting to acquire the lock.
Some of the techniques, in particular WinDbg, work only with SyncBlocks. These are code parts surrounded by the lock statement or Monitor.Enter. There are other command for ReaderWriterLock, which you can read about here
. Other synchronization mechansims like ManualResetEvent and AutoResetEvent are more difficult to debug with WinDbg.
To get started with WinDbg and Memory Dumps, check out this article.
Summary
This article summarizes a few techniques and tools to help debugging lock contentions. Conveniently, these tools are the main ones you need to know to debug any performance problems. Maybe except for PerfView , which I didn’t mention this time.
The main strategy to tackle any performance issues, not just lock contentions, that I recommend is pretty straightforward:
-
Start with performance profiling in Sampling mode if possible. This usually shows the problem right there.
-
If you don’t find the problem with profiling or it’s not possible for whatever reason, I look at performance counters, checking: % Processor Time, % Time in GC, Exception rate/sec, I/O read bytes, and Lock contention rate/sec. From there, according to the findings I proceed to a number of other methods:
- Timeline profiling with dotTrace
- Attaching a debugger (Visual Studio, WinDbg, dnSpy ) during the slowness to try and see what happens
- Collecting with PerfView if you can’t use standard performance profilers
This article is a small peek into the performance chapter of my upcoming book – Practical Debugging for .NET developers. Subscribe to get updates on the book’s progress. So I hope you enjoyed this one and happy debugging.


