Demystifying Memory Profilers in C# .NET Part 1: The Principles

Memory problems are some of the most important and potentially devastating things in .NET. Even though the applications works on top of a managed environment (the CLR) that includes automatic garbage collection, memory issues didn’t disappear. Far from it. It’s still as important as ever to understand how memory works and how to deal with problems.
The two biggest memory-related issues in .NET are memory leaks and memory pressure (aka GC Pressure). They cause pretty inconvenient effects like out-of-memory crashes, performance problems, high memory consumption, and “live” objects that should have been collected but remain alive and still execute code. Our primary tools when dealing with those issues are memory profilers. They are one of the most important category of tools in .NET troubleshooting, and in this article, you’ll see how to use them and extract the most information from them.
Besides solving problems, like memory leaks and GC pressure, memory profilers are also great to navigate between objects in memory, see instance values, and solve logical problems.
This article assumes you have basic to intermediate knowledge of garbage collection in .NET. If you start reading and feel the need to catch up, here’s a good article on the basics of GC: Understanding Garbage Collection in .NET .
Available Memory Profilers for .NET
There are several excellent profilers in the .NET ecosystem. Here are the most widely used:
- SciTech’s .NET Memory Profiler – One of the oldest and most powerful profilers in the market. It has a ton of capabilities, many of which are unique.
- dotMemory – An excellent, very intuitive profiler from JetBrains.
- ANTS Memory Profiler – This profiler is also one of the oldest in the market, somewhat similar in its offering to SciTech’s.
- PerfView – This is an open-source diagnostics tool from Microsoft that’s based on ETW events . It can do everything including performance profiling, memory profiling, analyzing ETW events, and producing a ton of useful reports. Be warned – it’s has a really steep learning curve.
- Visual Studio’s built-in profiler – Visual Studio has a very basic integrated profiling capabilities. Well, at least in comparison to the commercial tools.
In this article, we’ll be using screenshots and terms from dotMemory and SciTech’s profiler. But these terms are pretty similar to all of these tools.
Working with Memory Profilers
There are several ways to work with memory profilers (not all profilers support all the ways):
- Run a .NET process with profiling – Specify the path to the executable and the profiler will run it and start gathering information immediately. This allows for the most capabilities.
- Attach to a running process – Probably the most convenient mode of analysis, but has some limitations that have to do with the profiling API and attaching to process.
- Import memory Dump – A very useful feature. You’ll be able to import a dump file and investigate its memory. It’s common to capture dump files on a production machine and analyze them on a development machine. It might be a dump caused by an
OutOfMemoryException, or you might want to create a dump file when your app reaches some memory threshold, which is possible to do with ProcDump and DebugDiag . Importing dumps is supported only by dotMemory and SciTech’s profiler. - Remote profiling – Some profilers allow remote profiling of your application in production. SciTech’s profiler allows to remote debug from a machine in your Local Area Network, which is not good enough if your application is in the cloud. dotMemory allows remote debugging on any server machine if you run their agent program on your server.
- Command Line – dotTrace, SciTech’s memprofiler, and PerfView have a command-line interface. This means you can copy the profiler (or its agent) to the production machine, collect a snapshot with the command line, and copy it back to the development machine to investigate. You might want to capture several snapshots and compare them. Alternatively, you can capture a memory dump and open it with a memory profiler. It will be as good as a collected snapshot.
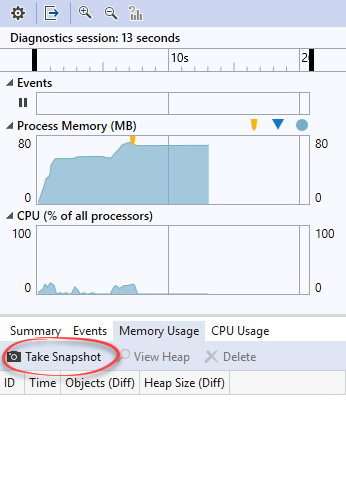
- While Debugging from Visual Studio – VS’s built-in profiler is pretty convenient when debugging. Getting a snapshot is as simple as going to Diagnostic Tools | Memory Usage | Take Snapshot.
NOTE: As far as I know, none of the profilers currently support ASP.NET Core on Linux at the time of writing this. But all of them support .NET Core on Windows.
How Memory Profilers Work Under The Hood
Memory profilers use a technology called the Profiling API . The CLR allows an agent process (the Profiler) to profile (attach) to a running process. Once profiling, the profiler can get information on stuff happening in the analyzed process. This includes:
- CLR startup and shutdown events.
- Assembly loading and unloading events.
- Module loading and unloading events.
- Class loading and unloading events.
- Thread creation and destruction events.
- Function entry and exit events.
- Exceptions occurring.
- Transitions between managed and unmanaged code execution.
- Information about the runtime memory heap and garbage collection activity.
- And others
The profiler agent lives inside the same process as the profiled program, and it can access the same memory.
In addition to the received information, the profiler can manipulate the main process’s code. For example, the profiler might add a piece of code that executes whenever a certain function begins.
The profiling API provides all the information about the process’s memory. The cost is a significant performance overhead. You probably don’t want to have a profiler attached in production.
The exception to this rule is PerfView, which doesn’t use Profiling API. Instead, PerfView uses ETW events to get information on everything that happens with the garbage collector. This includes events on each allocation, each garbage collection, each generation promotion, etc. The upside of using PerfView is that it has less of a performance overhead. You can run PerfView in production and set it to create a snapshot automatically on some trigger— for example when memory reaches a certain threshold.
What Memory Profilers Let You Find Out
While attached to the process, a memory profiler will show overall memory usage in your process. Memory size in each generation of the GC heap, unmanaged memory size, collection times, etc. This is the same data you can get from performance counters , but the profilers visualize it much better.
At any time, you can Take a Snapshot. A snapshot is a representation of the entire application memory at the moment it was captured. The real value of memory profilers is investigating these snapshots. When investigating a snapshot, you’ll be able to:
- See a list of all objects in the memory heap.
- Who these objects reference and who references them.
- See shortest path to root for each instance, which will show you why objects are still referenced and weren’t garbage collected.
- See allocation call stacks (the methods that called
new My Object()). - Garbage collection generation— Find out if the object is in Gen 0, Gen 1, Gen 2, or in the Large Object Heap.
Besides investigating a single snapshot, performance profilers allow to compare several snapshots. When comparing two snapshots in the same profiling session (taken in the same process), you’ll be able to see objects that were alive in both snapshots, objects that are already dead because they were collected, and new objects that were allocated in between snapshots. This is especially useful to find memory leaks, which we’ll discuss later in detail. You can also compare snapshots from different profiling sessions, which shows differences in object size and count.
Terms and Concepts in Performance Profilers
To successfully profile an application, we need to understand certain terms. Learning them will also help to better understand how memory works in .NET.
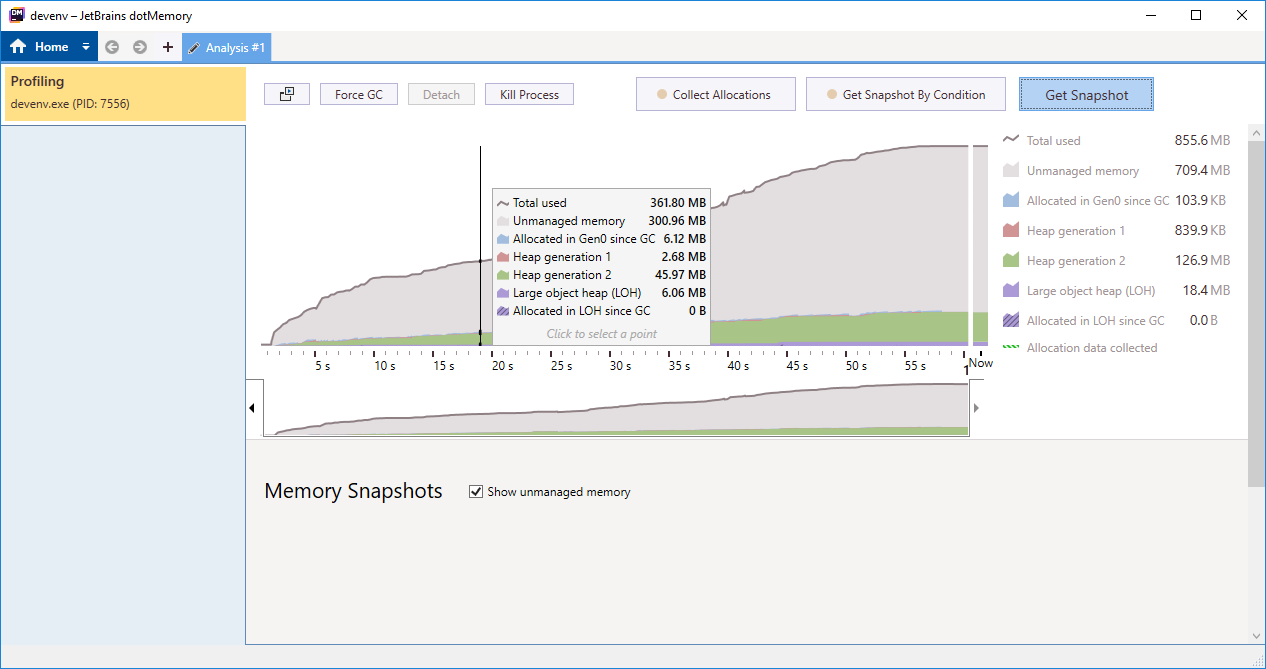
Let’s consider the screenshot above, captured from dotMemory. That’s a real-time view of an application’s memory during runtime. It shows what the current memory consists of, and how the garbage collector behaves. Let’s go over the terms:
- Total [memory] used – Total memory used by the application.
- Unmanaged memory – Memory allocated by native code. This memory is not related to the .NET generational garbage collector.
- Allocated in Gen0 since GC – Bytes allocated in Gen 0 heap since last garbage collection.
- Heap generation 1, 2 – Bytes allocated in heaps of Gen 1 and Gen 2. The size of Gen 0 is fixed, so it’s not shown.
- Larget object heap (LOH) – Bytes allocated in the LOH.
SciTech’s memory profiler shows somewhat different statistics:
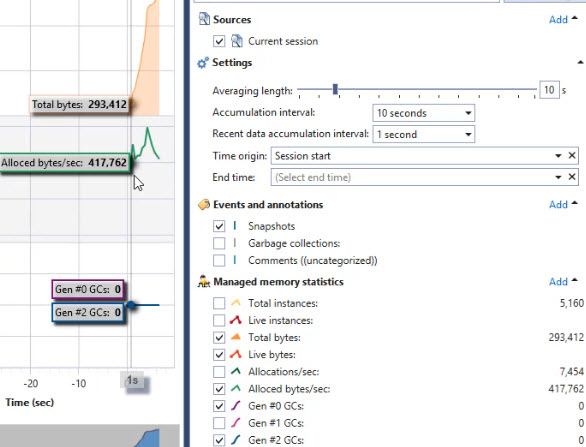
- Total instances – Total count of object instances in memory.
- Live instances – Instances that are reachable from a GC root, and won’t be reclaimed if a garbage collection starts immediately. The difference between Total instances and Live instances are dead instances that will be reclaimed on the next GC collection.
- Allocations/sec – Number of allocations per second.
- Alloced bytes/sec – Number of allocated bytes per second.
- Gen #X GCs – Number of garbage collections of generation X per second. This is important to find out if there’s GC pressure. When you see many Gen 2 collections it means memory management is not optimal and the garbage collector works more than it should.
This information provides a bird’s eye view of your application’s memory health. These stats can indicate memory leaks or memory pressure, but more on that later. Note that all this data can be consumed with performance counters, but memory profilers visualize this much better.
NOTE: A very important statistic is not included here, and that is the performance counter .NET CLR Memory | % Time in GC. This counter shows how much time your process spends in garbage collection, which directly indicates GC pressure.
Terms and Concepts When Analyzing a Snapshot
The real power of memory profilers is analyzing memory snapshots. The most important screen to understand is the one in the Overview or Types screen, which shows all the objects in memory, grouped by Type.
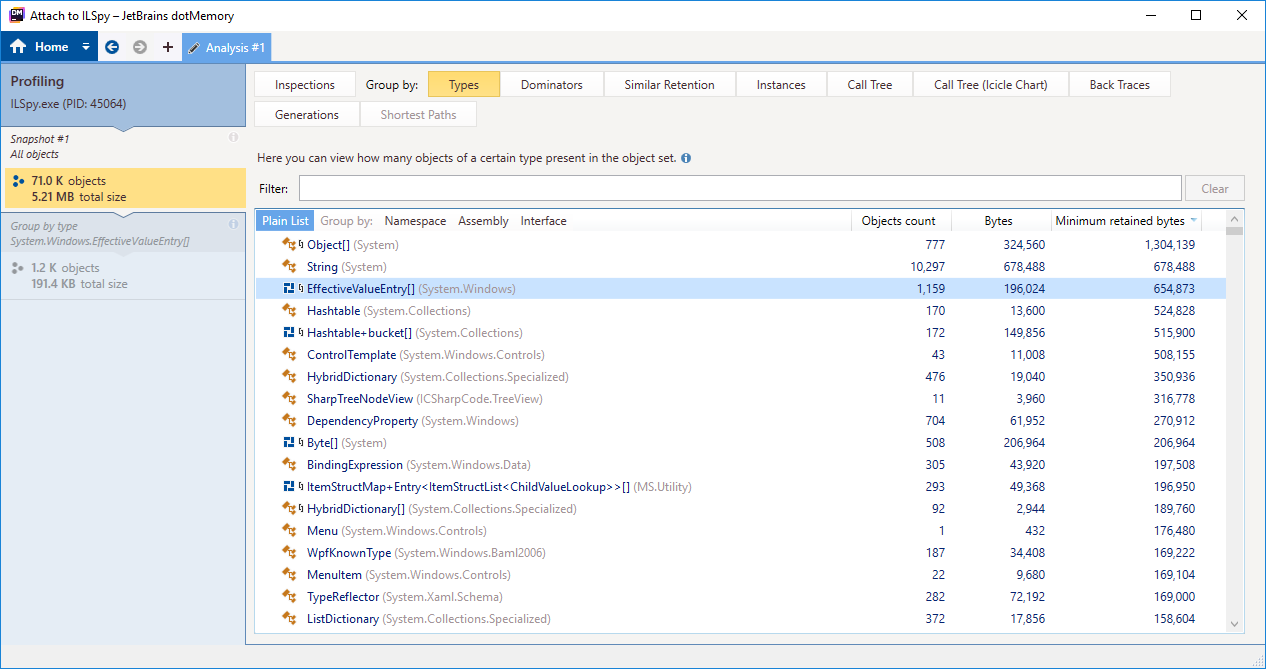
Let’s go over the columns:
- Objects count – Number of live objects of this type.
- Bytes – Total bytes of all objects of this type. This doesn’t include objects of other types referenced by this type.
- Reachable instances – Total bytes of all instances of this type, including the objects referenced by this type.
- Minimum retained bytes (Held bytes in SciTech’s profiler) – Total bytes of all objects of this type, including the objects referenced by this type, but only objects that are referenced only by this type. So this includes only objects that would be freed if all objects of this type disappeared.
Consider the following classes:
  class Person
  {
      public string FullName { get; set; }
      public int Id { get; set; }
      public Address LastAddress {get; set; }
  }

  class Address
  {
      public string StreetAddress { get; set; }
      public string City { get; set; }
  }
An instance of type Person is going to be 20 bytes in a 32-bit process. This includes an Object Header1 (4 bytes), Method table pointer2 (4 bytes), an int field (4 bytes) and two references (4 bytes each). So the Bytes indicator for each object is 20 bytes. However, the Retained bytes (aka Reachable instances) also includes the number of bytes in string FullName and the number of bytes in Address LastAddress. Minimum retained bytes (aka Held bytes) depends on whether string FullName and Address LastAddress are referenced by other objects. If, for example, all addresses are also stored in another data structure, then they will not be included in minimum retained bytes.
Here’s an example:
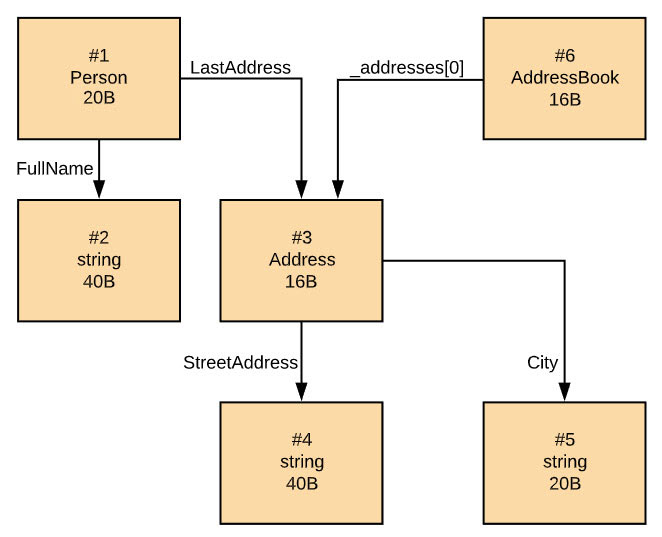
| Type | Objects count | Bytes | Minimum retained bytes | Reachable instances bytes |
|---|---|---|---|---|
| Person | 1 | 20 | 60 | 136 |
| string | 3 | 100 | 100 | 100 |
| Address | 1 | 16 | 76 | 76 |
| AddressBook | 1 | 16 | 16 | 92 |
Tip: In most cases, we’ll want to view objects sorted by Minimum retained bytes. This will give the best overall picture of which objects types are causing the most memory consumption.
Terms and Concepts When Comparing Snapshots
Memory profilers allow us to compare several snapshots to each other, this is extremely useful for finding memory leaks. When this happens, the most important view is the object type table.
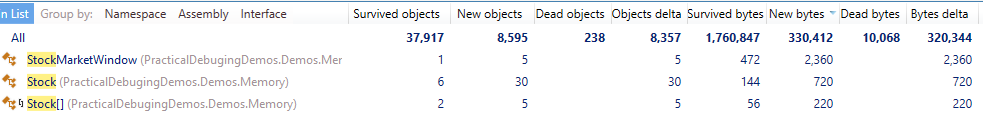
All columns that express size in bytes indicate the size of the instances of this type alone and don’t include objects referenced by this type (unlike Minimum retained bytes)
- Survived objects – Number of instances that existed in the first snapshot and still exist in the second snapshot.
- New objects – The number of new instances that were created between snapshots.
- Dead objects – The number of instances that were freed (garbage collected) between snapshots.
- Objects delta – The difference between new objects and dead objects.
- Survived bytes – The size in bytes of all of the instances that survived between the snapshots.
- New bytes – The size in bytes of all of the instances that were created between the snapshots.
- Dead bytes – The size in bytes of instances that were freed between snapshots.
Terms and Concepts When Investigating Instances
When analyzing a snapshot, you can investigate specific instances or all instances of a specific type. There are several things you can find out:
-
Go over the individual instances and see their value.
-
See other objects retained (held from being freed) by these instances.
-
See who references an instance and keeps it from being freed. This particular feature is extremely useful for finding the root cause of memory leaks. For this, it’s important to understand the concept shortest path to root.
The garbage collector keeps objects around only if they are referenced to a GC root. Objects can be referenced to a root in many different “paths”. They also can be referenced by multiple GC roots. To make our lives easy, memory profilers show the path with the fewest references, aka the shortest path to root. Here’s an example:
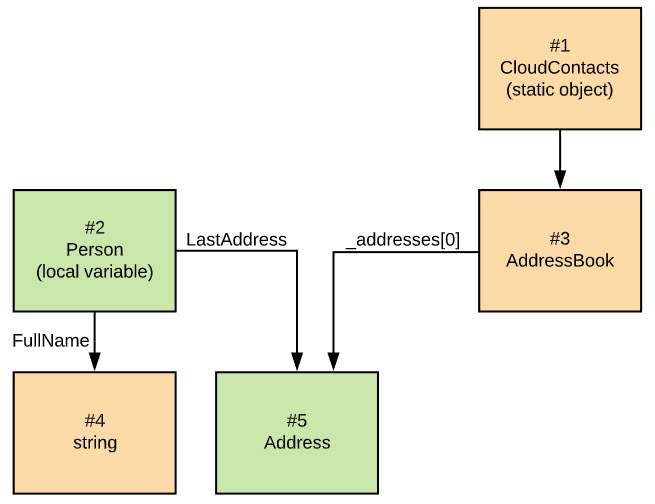
Instance #5 has two paths to GC roots— to #2, which is a local variable in a currently active thread, and to #1, which is a static object (all static objects are GC roots). The shortest path is from instance #2 because it includes just one reference.
Note that you might see several shortest paths to root when analyzing a group of instances. In a group, you’ll probably have many different short paths to root. The memory profile will show all the distinct paths to root.
Summary & Coming Up Next
In this article, we saw what are memory profilers, which profilers are available for .NET, and how these tools work. We covered the basic principles of these profilers, and what kind of information you can extract with them.
In Part 2 , we’ll see how to conduct an investigation with memory profilers, and specifically how to find memory leaks. We’ll see several ways to identify memory leaks, what kind of issues they can cause, how to find the leaky objects, and how to fix the leak.
In Part 3, we’ll see how to conduct an investigation with memory profilers to find and solve memory pressure (aka GC Pressure). We’ll see how correct memory management is crucial to the performance of a .NET process. And we’ll see that we need to design our application in a “garbage collector friendly” way to get the best performance.
Happy profiling!