Use Performance Counters in .NET to measure Memory, CPU, and Everything - Full Guide

There’s an incredible built-in mechanism in Windows called Performance Counters that allows you to follow a whole lot of useful metrics. It’s easy to use, comes free, and perhaps not used as much as it deserves.
Here are some of the things you can measure with performance counters:
- CPU Usage
- Memory Usage
- Number of exceptions thrown in a process
- Number of requests in your ASP.NET application
- Request response time in your ASP.NET application
There are hundreds of different counters you can monitor and they come as specific as possible. For example, if you want to find out about Memory Usage of a process, there are counters for Private Bytes, Virtual Bytes, Working Set, Working Set – Private, Gen X Collections, % Time in GC, Large Object Heap Size, and many more.
In this article, we’ll see how to monitor performance counters with PerfMon, how to monitor them in Azure, which are the most valuable counters and how to write your own custom counters in code.
Using Performance Counters in PerfMon
The main tool to monitor performance counters in Windows is Performance Monitor (also known as PerfMon). This tool is already included in Windows and you can find it by typing “PerfMon” in the start menu or even running the “perfmon” command anywhere in the command line.
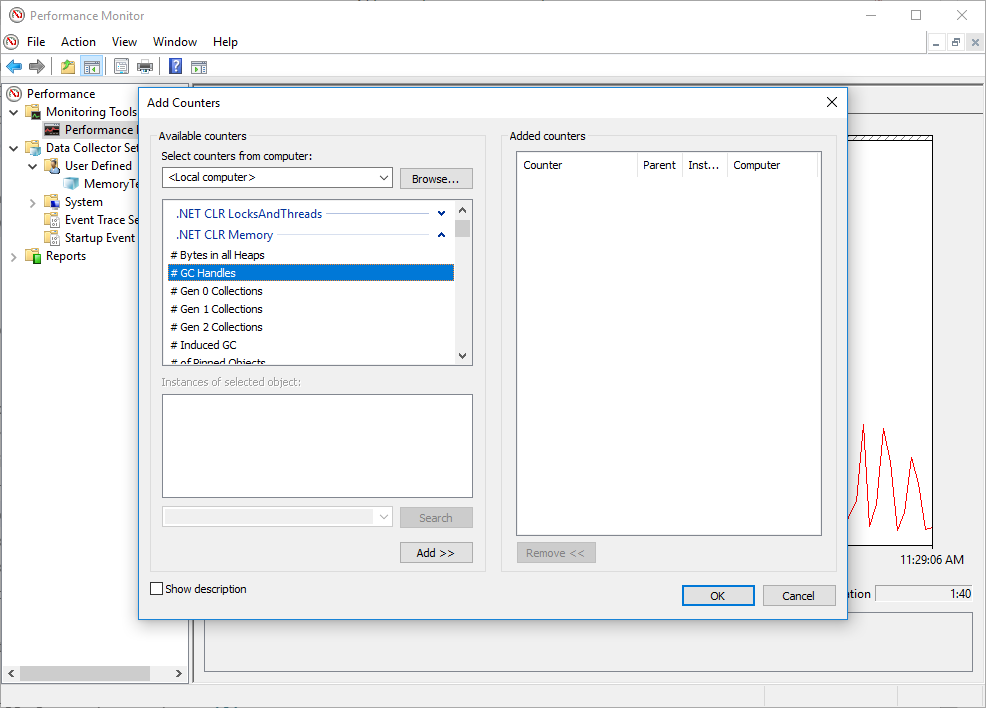
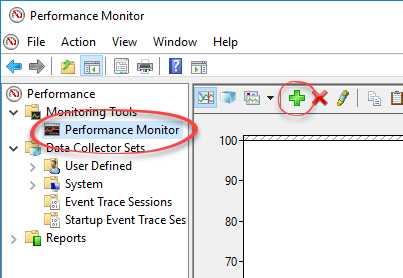
To see performance counters live, click on Performance Monitor in the left menu. You might see a single default counter % Processor Time already exists. To add more counters, click on the “+” icon.
In the dialog that appears you’ll see Categories, Counters and Instances. A category contains many counters. Each counter might contain multiple instances that allow monitoring that counter in more specific detail.
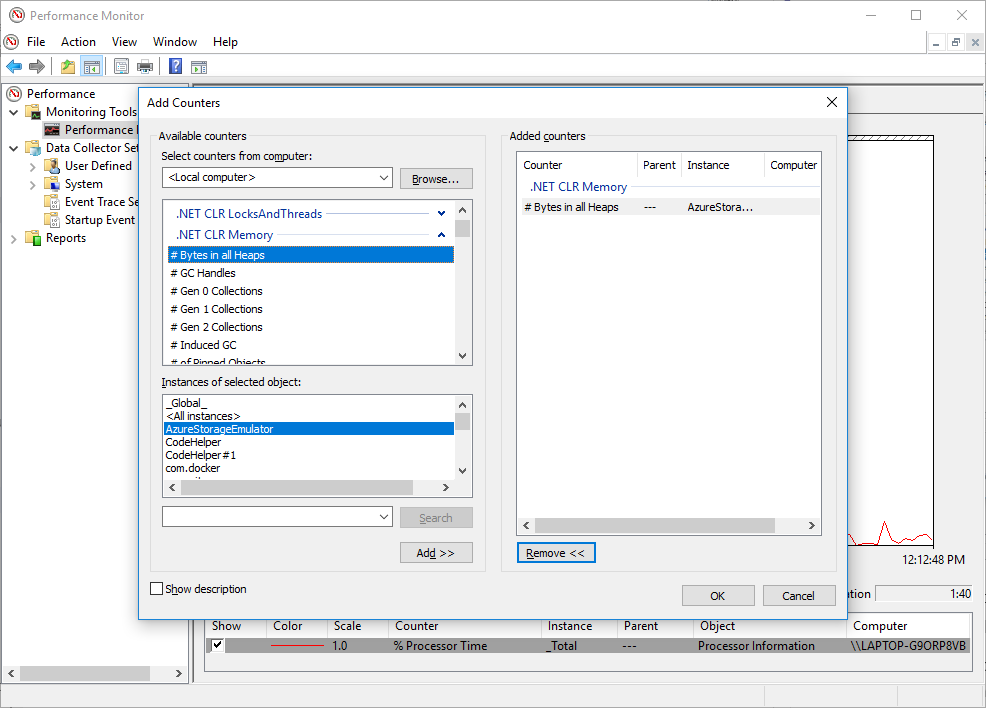
In the above image, I added the counter # Bytes in all Heaps with the instance AzureStorageEmulator. In this counter, like in many others, the instances are processes. This means the counter will measure only bytes of the process ‘AzureStorageEmulator’.
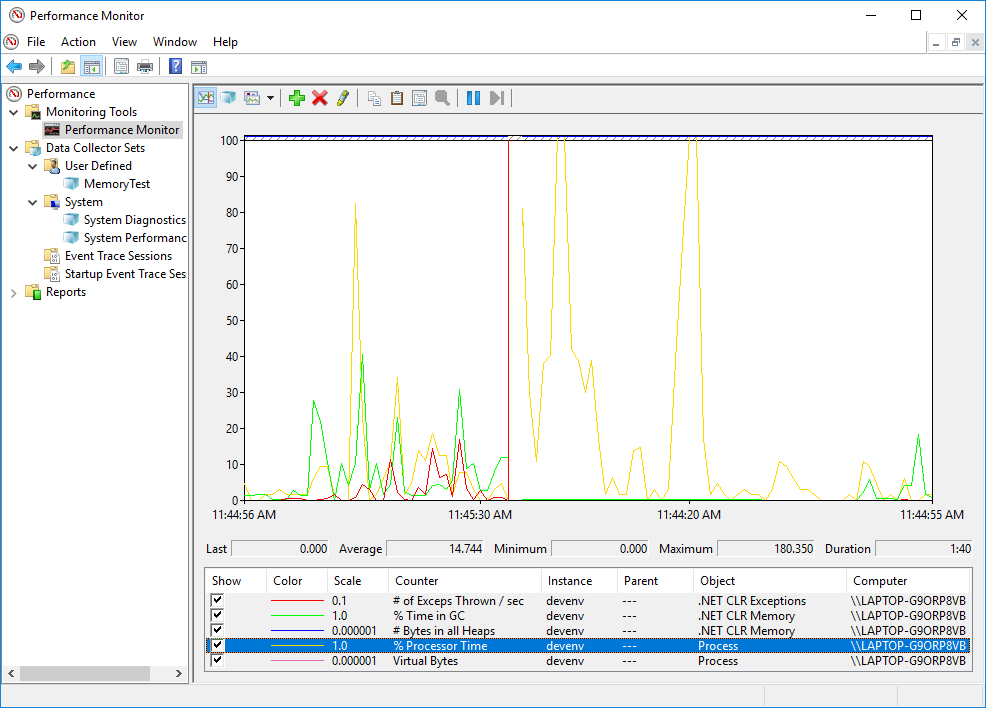
Once added, the new counters will appear in the graph. You can change color, scale, line style, and other properties.
You can also save monitor sessions to a file. To do that, first, add whatever counters you want to be recorded. Then, right-click on the “Performance Monitor” item in the left menu and select New | Data Collector Set. Give it an appropriate name and log directory.
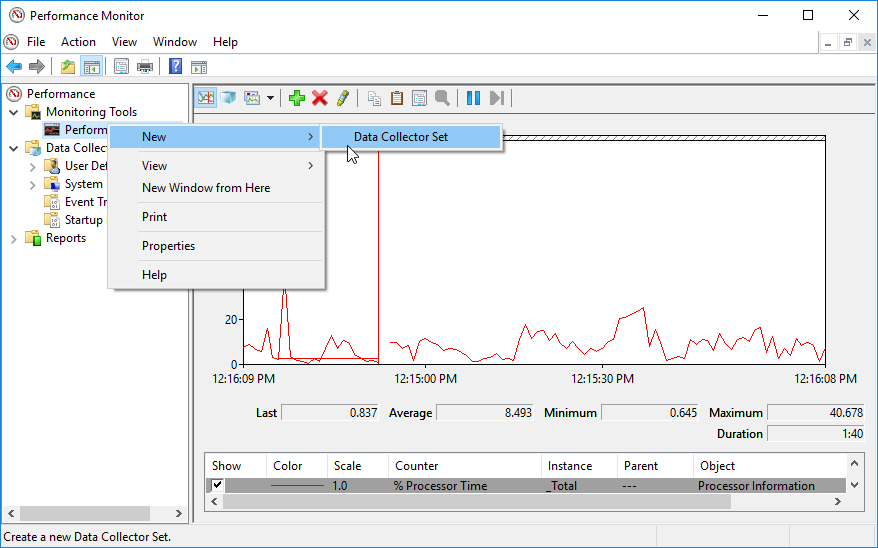
The new set will appear in the left menu in Data Collector Sets | User Defined. To start recording, right-click on the collector set and select Start. To stop, right-click and select Stop. A .blg file will be created, which you can later open in PerfMon.
Monitoring Performance Counters in an Azure App Service
There are a couple of ways to monitor performance counters in Azure. You can do it with Application Insights and with Azure Diagnostics . Here’s the documentation on setting up the counters on your server.
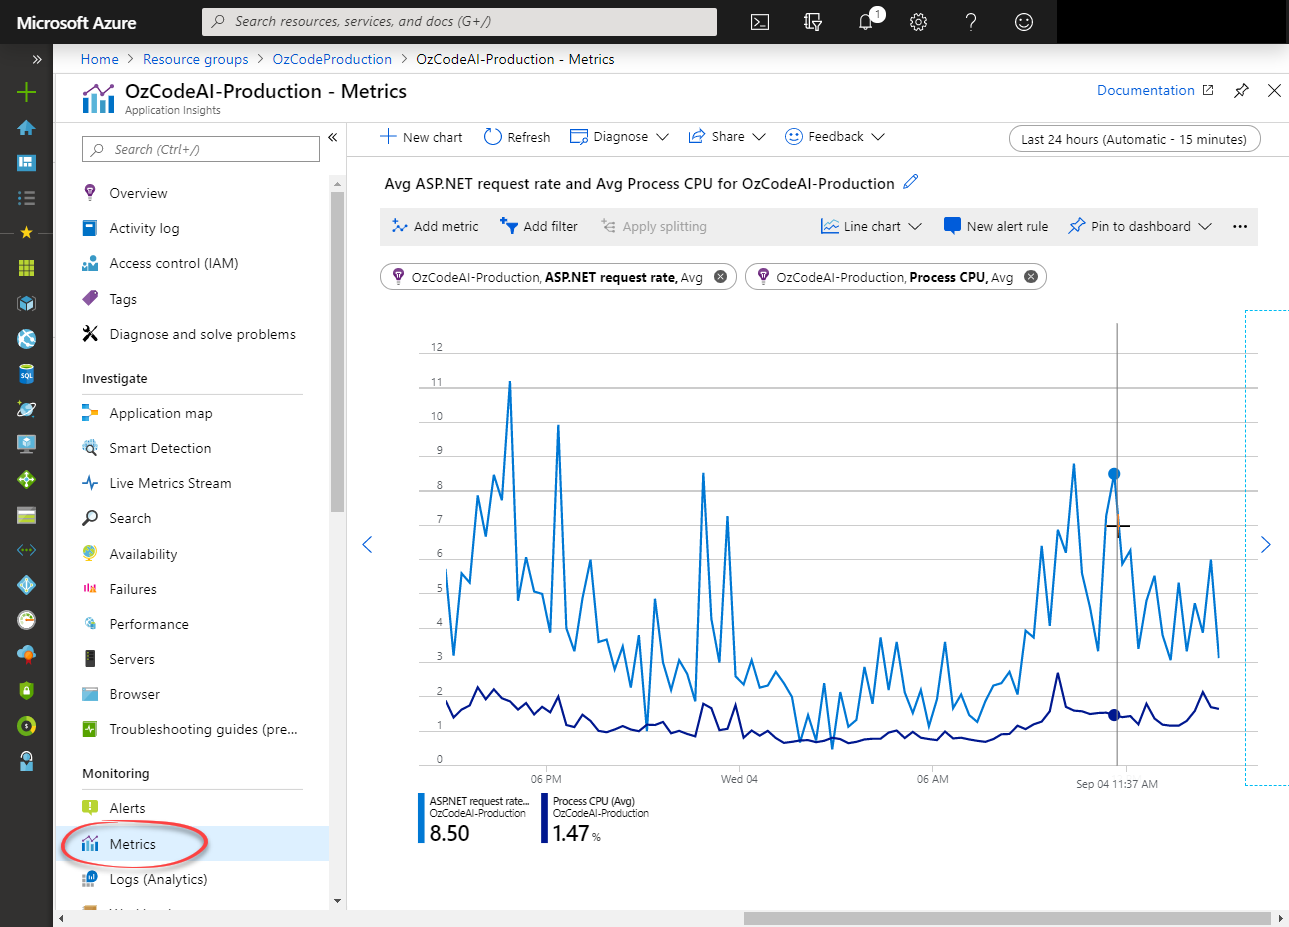
If you have Application Insights set up, then it collects some counters by default without any additional configuration. You can navigate in Azure Portal to the Application insight resource | Metrics. In there, you’ll be able to view any of the default counters in a graph much like in PerfMon. Just click Add metric and choose the counter.
By editing ApplicationInsights.config , you can add whatever counters you want. These might be from the OS, from ASP.NET or your code.
Performance Counters in .NET Core on Linux
Performance counters support in Linux is still not great but Microsoft is working to better this situation.
Right now, Linux has a Performance Counter equivalent called Perf , which you can use.
There’s also a Microsoft cross-platform tool called dotnet-trace that allows collecting performance counters (and ETW events) on Linux. The collected files can be copied to a windows machine and viewed with PerfView . Unfortunately, PerfView is great for ETW but not as suited for performance counters. Also, copying the data to a different machine kind of defeats the purpose of live monitoring.
As far as Azure, I didn’t check this myself, but according to application insights documentation , performance counters should work just as well when your server is on a Linux machine.
Most valuable counters for debugging
There are different important counters for each type of troubleshooting. On hung applications we’ll check one thing, whereas for a slow performance we’ll check other things. ASP.NET has its own set of counters.
Important CPU Counters
- Process | % Processor Time (Total or per process) – Shows CPU usage for the entire machine or a specific process. Can indicate a lot of issues. On hung apps, if the Processor Time maxes out, then the process is stuck on a CPU-bound operation like an endless loop. If the Processor Time is 0, then it might be a deadlock or stuck on an I/O request. Note that this number reaches up to 100 * [number of logical CPUs]. So when you see 100% value, it doesn’t mean the CPU maxed out.
- Process | % Privileged Time – Like % Processor Time except that it includes just the time the processor spends in kernel mode. Only core OS components and some drivers run in kernel mode. In this mode, the code can do anything and access any memory address. Like modifying registers and enabling interrupts.
- Process | % User Time – Like % Processor Time except that it includes just the time the processor spends in user mode. That is, not kernel mode.
- Processor | % Processor Time – Shows % Processor Time per thread instead of per process. The instances represent the logical CPU cores.
Important Memory Counters
There are 3 main categories for Memory: .NET CLR Memory for managed memory, Memory, and Process.
- Private Bytes – Shows committed process memory (both managed and native). This represents memory that’s not shared with other processes.
- Virtual Bytes – The virtual memory allocated for the process. This is both used memory and reserved memory. It will always be equals-to or greater-than Private Bytes. It includes shared DLLs.
- Working Set – The physical memory consumed by the process, including shared DLLs that are also used by other processes.
- # Bytes in all Heaps – Includes the sum of all managed heaps – Gen 0 + Gen 1 + Gen 2 + LOH. This represents the allocated managed memory size.
The best counter to monitor for Memory Leaks is Private Bytes. If it keeps rising, then you probably have a memory leak on your hands. If you want to isolate the problem between managed and native memory, check the # Bytes in all Heaps counter, which measures the managed memory. If it rises along with Private Bytes, then it’s a managed memory problem. If it stays stable while Private Bytes rises, then it’s a native memory problem.
- Gen X Collections – Number of garbage collector collections. It’s worth checking for performance problems. If it’s very high, you might have a memory pressure (GC pressure) problem. Gen 2 collections specifically should be low because those collections are very slow.
ASP.NET Important Counters
The following counters will be active only when an ASP.NET application runs on the machine.
- Web Service\ISAPI Extension Requests/sec – Number of requests handled per second in an ASP.NET application.
- Requests Current – Number of currently handled requests. Both queued and currently executing. A high number can indicate a problem.
- Application Restarts – An application restart is expensive and can cause performance issues. Restarts can happen due to modifications of Web.config, maching.config or global.asax, modification of the bin directory, and for other reasons.
For a very useful and explained list of ASP.NET counters, see this article in Microsoft docs.
General Important Counters
- # of Exceptions thrown / sec – A large number of exceptions thrown per second can significantly hurt performance. These are usually first-chance (handled) exceptions.
- IO Data Bytes/sec – Number of bytes your process sends and receives.
Performance Counters In code
There’s a pretty straightforward API in the .NET Framework to monitor performance counters yourself with the System.Diagnostics.PerformanceCounter class. Here’s an example:
var currentProcess = Process.GetCurrentProcess().ProcessName;
PerformanceCounter privateBytes =
    new PerformanceCounter(categoryName:"Process", counterName:"Private Bytes", instanceName:currentProcess);
PerformanceCounter gen2Collections =
    new PerformanceCounter(categoryName:".NET CLR Memory", counterName:"# Gen 2 Collections", instanceName:currentProcess);
Debug.WriteLine("private bytes = " + privateBytes.NextValue());
Debug.WriteLine("gen 2 collections = " + gen2Collections.NextValue());
The above code simply takes the current value of 2 counters and prints them.
It’s also not too difficult to create your custom performance counter. I created an example where I have the most useless performance counter in the world. It reports the current system-time second. Here’s the code:
bool exists = PerformanceCounterCategory.Exists("MyTimeCategory");
if (!exists)
{
    PerformanceCounterCategory.Create("MyTimeCategory", "My category help",
        PerformanceCounterCategoryType.SingleInstance, "Current Seconds",
        "My counter help");
}
PerformanceCounter pc = new PerformanceCounter("MyTimeCategory", "Current Seconds", false);
while (true)
{
    Thread.Sleep(1000);
    pc.RawValue = DateTime.Now.Second;
}
The above code creates a new counter if it doesn’t exist. In this case, it’s a single-instance counter. Once a second it updates the counter’s value to the system-time second. Now I can run the code, open PerfMon and add the new counter. The result is this:
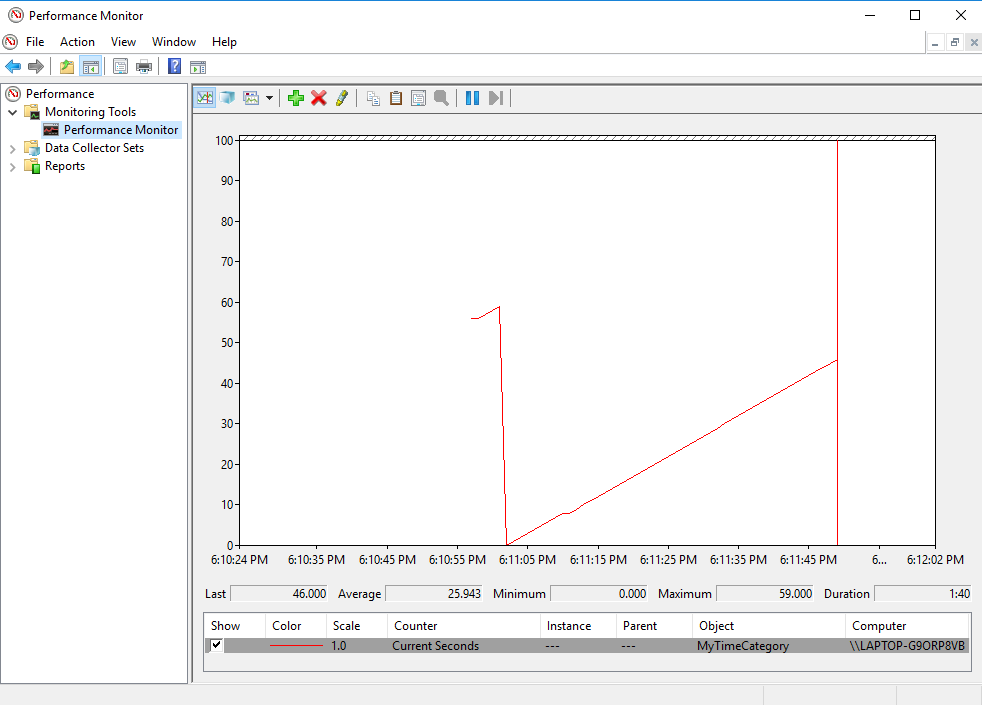
This can be useful in some cases. You’ll be able to add stuff like “Transactions/sec” or “Logged-in Users”. Then, easily monitor your new counters in any environment, including in Azure.
Summary
Performance counters are a pretty helpful feature in .NET debugging and monitoring. Although they usually can’t help to find the root causes of a problem, performance counters can point us in the right direction. For example, if you have performance problems, you’ll be able to easily see if they are related to memory, CPU, or too many exceptions.
Thanks for reading and keep following on my new articles.