Everything has its limit, right? A car can drive only so fast, a process can use only so much memory, and a programmer can drink only so much coffee. Our productivity is limited by our resources, but we have the ability to make better or worse use of them. The goal should be to use each of our resources as close to its limit as possible. We want to use every bit of our CPU and memory or else we’re over-paying for expensive machines. But if we use too much of those resources, we run the risk of causing performance problems, unavailable service issues, and downright crashes. It’s a tricky game to play and that’s what we’re going to talk about today.
Defining the optimal behavior
Let’s try to describe our best application behavior. Suppose we have many server machines that need to process a high throughput of requests. For simplicity, let’s forget for a moment about peak hours or weekends. Our server load is more or less the same at all hours of the day. We pay a lot of money for those server machines and we want to get as much value from them as possible, which translates to handling as many requests as possible. Following our commitment to simplicity, let’s also assume that the servers use only memory and CPU to process said requests, and don’t have other bottlenecks like a slow network or lock contentions.
Our optimal behavior in the described scenario is to use as much CPU and memory as possible at any given time, right? This way, we can make do with fewer machines for the same amount of requests. But you probably don’t want to utilize something like 99.9% of those resources because a slight increase in load can cause performance issues, server crashes, data loss, and other headaches. So we should opt for a high number with enough buffer for problems. Something like 85% or 90% utilization of CPU and memory on average sounds about right.
What should we optimize first?
Our application isn’t built to utilize CPU and memory equally. Or to the exact limits of the machine it’s hosted on. So the first thing you should look at is whether your servers are CPU-bound or Memory-bound. When a server is CPU-bound it means that the amount of throughput the server can process is limited by its CPU. In other words, if you try to process more requests, the CPU will reach 100% before other resources (like memory) reach their limit. The same logic goes for a Memory-bound server. The server’s throughput will be limited by the memory it can allocate, which will reach 100% when trying to process more load, before other resources (like CPU) reach their limit.
There are other resources that can limit the server like I/O, in which case the throughput is limited by reading or writing to disk or network. But we’re going to ignore that in this post, optimistically assuming our I/O is fast and limitless.
Once you know what limits your server’s performance, you have the answer as to what to try and optimize first. If your server is CPU-bound then there’s no point in optimizing memory usage because it won’t improve the handled throughput. In fact, it can hurt the throughput because you might improve memory usage on account of more CPU utilization. The same goes for a memory-bound server, in which case you should optimize memory usage before looking at CPU.
Measuring CPU and Memory consumption in a .NET Server
The actual measuring of CPU and Memory is most simply done with Performance Counters . The metric for CPU usage is Process | % Processor Time. There are several metrics for memory, but I suggest looking at Process | Private bytes. You might also be interested in .NET CLR Memory | # Bytes in all Heaps which represents the managed memory (the part taken by the CLR as opposed to all memory, which is managed + native memory).
To see performance counters you can use Process Explorer or PerfMon on a Windows machine or dotnet-counters on a .NET Core server. If your application is deployed in the cloud, you can use an APM tool like Application Insights (part of Azure Monitor ) that shows this information out of the box. Or you can get performance counter values in code and log them once every 10 seconds or so, using something like Azure Data Explorer to show the data in a chart.
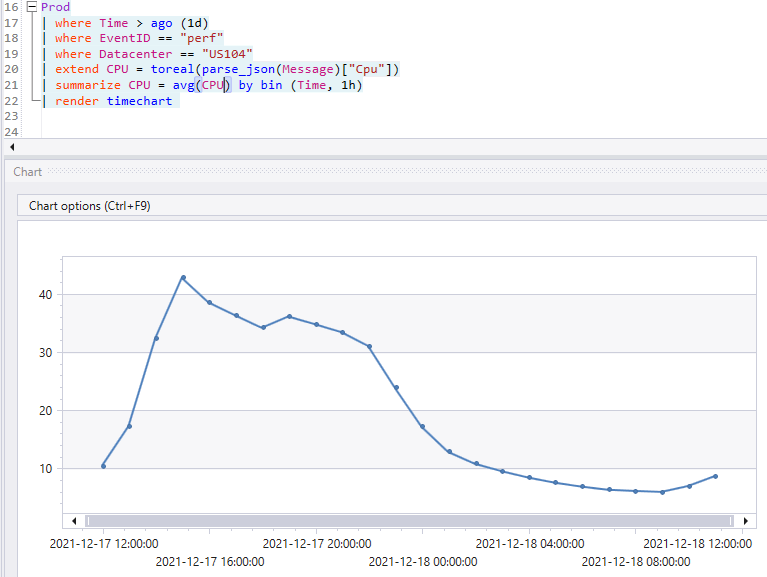
TIP: Check both machine-level metrics and process-level metrics. You might discover that other processes are limiting your performance.
Once you figure out which resource limits your .NET server, it’s time to optimize that resource consumption. If you are CPU-bound, let’s reduce CPU usage. And if you’re memory-bound, let’s reduce memory usage.
One easy way to go, at least if you’re running in the cloud, is to change machine specs. If you’re Memory-bound, increase memory. And if you’re CPU-bound, increase the number of cores or get faster CPUs. That will improve costs, but before doing that, you can check some low-hanging fruits towards optimizing CPU or memory consumption. Try and do these optimizations before changing machine specs because everything will change after optimizing. You might optimize the CPU usage and become memory-bound. Then optimize memory usage and become CPU-bound again. So if you want to avoid having to keep changing machine resources to fit the latest optimization, best leave it for last.
So let’s talk about some memory optimizations.
Optimizing Memory Usage
There are quite a few ways to optimize memory usage in .NET. To talk about them in-depth requires a whole book, and there are several of those already. But I’ll try to give you some direction and ideas.
1. Understanding what takes up your memory
The first thing you should do when trying to optimize memory is to understand the big picture. What takes up most of the memory? What data types? Where are they allocated? How long do they stay in memory?
There are several tools to get this information:
- Capture a dump file and open it with a memory profiler or WinDbg .
- Use the new GC Dumps (.NET Core 3.1+) and investigate them with Visual Studio.
- Capture a heap snapshot and explore it with a memory profiler , PerfView , or Visual Studio Diagnostic Tools .
This analysis will show which objects take most of your memory. If you find that it’s taken by MyProgram.CustomerData then all the better. But usually, the biggest object type will be string, byte[], or byte[][]. Since pretty much everything in an application can use those types, you’ll need to find who references them. For that, it’s important to look at Inclusive memory taken (aka Retained memory). This metric includes not just memory taken by the object itself, but also memory taken by objects it references. For example, you might find out that MyProgram.Inventory.Item doesn’t take much memory by itself, but it references a byte[] that holds in-memory images and takes up to 70% of your memory. All of the tools described above can show objects with most inclusive bytes and reference paths to GC root (aka shortest path to root
).
2. Understanding who put the memory where it is
Finding who references the biggest chunk of memory is great, but that might not be enough. Sometimes you need to know how this memory was allocated. You might know from the reference path that some objects taking most of the memory are located in cache, but who put them there? A memory snapshot from a single point in time can’t provide that answer. You need allocation stacks traces for that. Profilers give you the ability to record your app and save the call stacks each time there’s an allocation. For example, you might find that the flow that creates the problematic MyProgram.Inventory.Item objects allocates them in the call stack App.OnShowHistoryClicked | App.SeeItemHistory | App.GetItemFromDatabase.
To get allocation stacks you can:
- Use a commercial memory profiler to show allocations
.
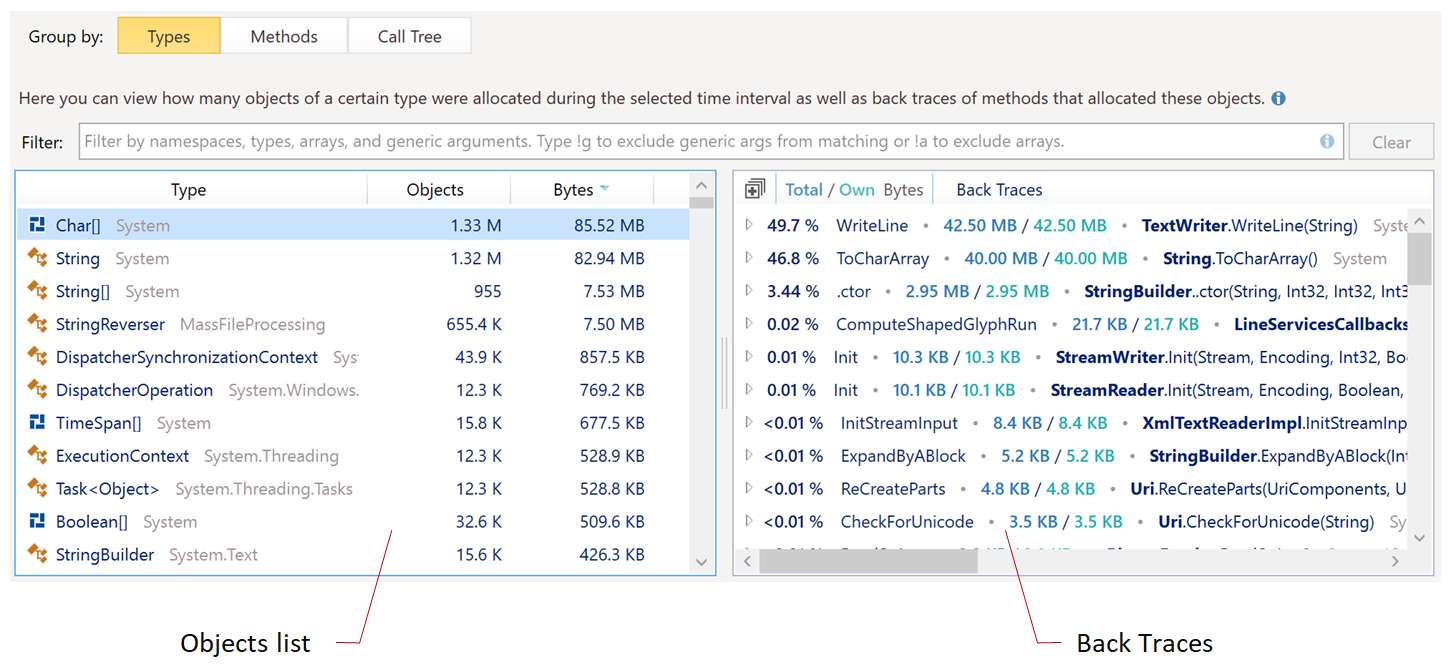
- Use one of PerfView’s GC Heap [] Stacks
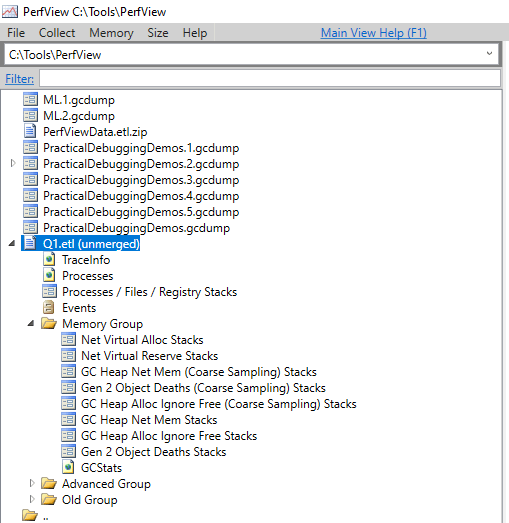
The allocations give you a complete picture of what takes up most of your memory and how it came to be. Once you know that, you can start chopping at the biggest chunks and optimizing them to reduce memory usage.
3. Check for memory leaks
It’s incredibly easy to cause memory leaks in .NET. With enough of those leaks, memory consumption is going to rise over time and you’ll have all sorts of problems. A memory bottleneck is one of them but you’re also eventually going to have CPU issues because of GC pressure.
Memory leaks happen when you no longer need objects but they stay referenced for some reason and the garbage collector never frees them. There are many possible reasons this might happen .
To find out if you have major memory leaks, look at a chart of memory consumption over time (Process | Private bytes counter). If the memory always goes up, without deviating around some level, you probably have memory leaks.

It’s fairly straightforward to debug leaks with a memory profiler .
4. Move to GC Workstation mode
There are several garbage collector modes in .NET. The main two modes are Workstation GC and Server GC. Workstation GC is optimized for shorter GC pauses and quicker interactivity, which is perfect for Desktop apps. Server GC has longer GC pauses and it’s optimized for higher throughput. In Server GC mode, the app can process more data between garbage collections.
Server GC creates a different managed heap per CPU core. That means it takes longer for the different gen X memory spaces to fill up and as a result, the memory consumption is higher. You’re basically trading memory for throughput. Changing from GC Server mode (the default for a .NET server) to GC Workstation mode will reduce the memory usage. This might be reasonable in smaller apps that don’t have a heavy request load. Maybe in a secondary process in your IIS host that’s running along with the main app.
There’s a great article on this by Sergey Tepliakov about this.
5. Check your caching
You should be able to see which objects consume your memory after step #1, but I want to give an extra emphasis on caching. Whenever high memory consumption is involved, it always ends up being memory leaks or caching in my experience.
Caching seems to be a magic solution to many problems. Why do something twice when you can save the result in memory and re-use it? But caching comes with a price. A naive implementation will keep objects in memory forever. You should be invalidating caches by time limit or in some other way. Caching also leaves temporary objects in memory for a relatively long time, which causes more Gen 1 and Gen 2 collections, which in turn causes GC Pressure .
Here are a few ideas to optimize caching for memory:
- Use existing caching implementations in .NET that make it easy to create invalidation policies.
- Consider opting out of caching for some things. You might be trading CPU or IO for memory, but when you’re memory-bound you should be doing exactly that.
- Consider using an out-of-memory cache. This might be saving data in a file or a local database. Or using a distributed cache solution like Redis .
6. Periodically call GC.Collect()
This bit of advice is counterintuitive because the best practice is to never call GC.Collect(). The garbage collector is smart and it should know on its own when to trigger collections. But the thing is a garbage collector thinks only of its own process. If it doesn’t have enough memory, it will take care to trigger collections and make room. But if it does have enough memory, the GC is perfectly happy to live with excess memory consumption. So the egoistic nature of the GC might be a problem for other processes living on the same machine, possibly hosted on the same IIS. This excess memory might lead to other processes reaching their limit faster or causing their respective garbage collectors to work harder because they might mistakenly think they are close to running out of memory.
You might think that if the other process’s GC will get to the point it thinks we run out of memory and work harder as a result, then our own process will think the same and trigger garbage collection solving the issue. But we can’t make that assumption. For one thing, those processes might run a different GC implementation version (because of a different CLR version). Besides, you have different application behavior that can make the GC work differently. For example, one process might allocate memory at a higher rate so the GC will start “stressing” about available memory sooner. The bottom line is that software is difficult and when you have multiple processes in one machine, as is often the case with IIS, you need to take that into account and possibly take some out-of-the-ordinary steps.
Optimizing CPU Usage
On the flip side of the coin is CPU usage. Once you’ve discovered CPU is the bottleneck of your application’s throughput, there are a lot of things to do about it.
1. Profile your application
The first step for optimizing CPU is to understand it. What exactly is causing this? Which methods are responsible? Which requests are the biggest CPU consumers and which flows? This is all answered by profiling the application.
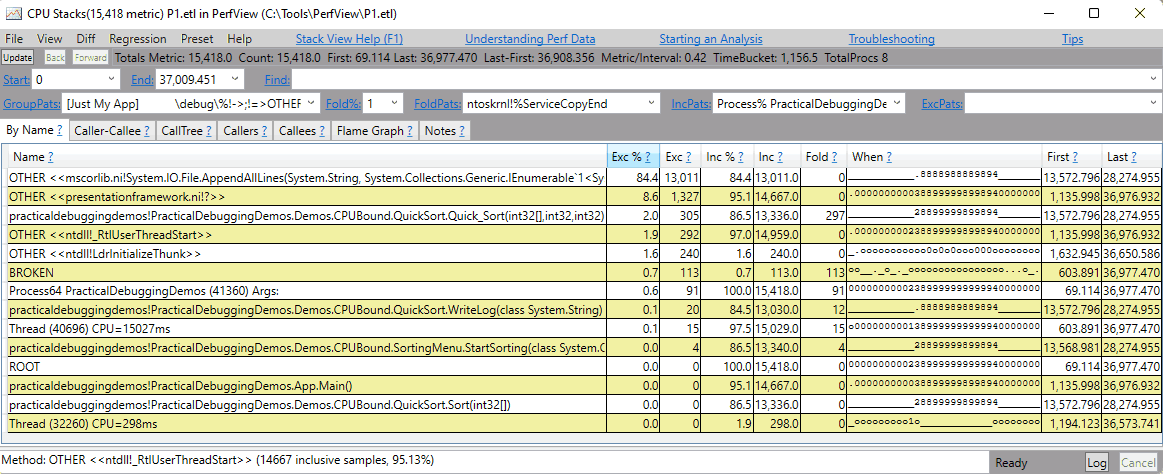
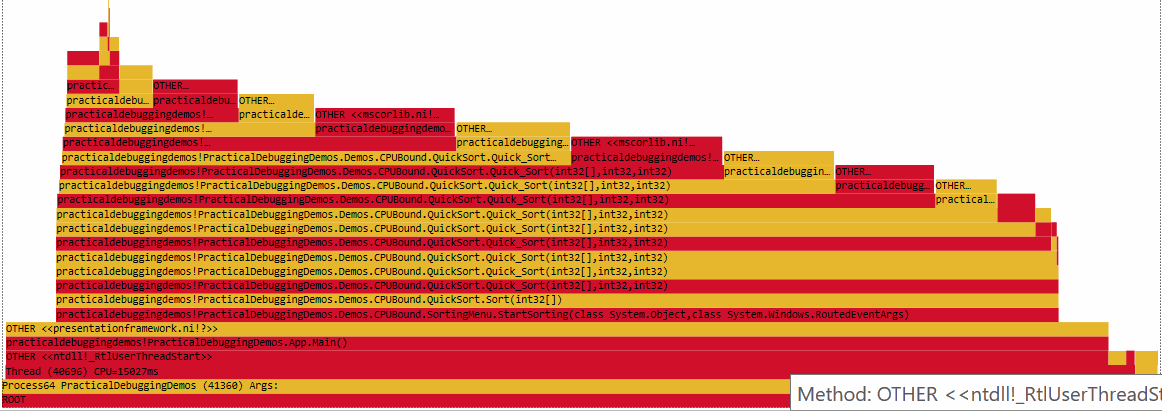
Profiling allows you to record a span of execution and show all the methods that were called and how much CPU they used during the recording. The profilers usually allow seeing these results as a plain list, a call tree, and even a flame graph.
Here’s a plain list view in PerfView:
And here’s a flame graph of the same scenario:
The ways you can profile your app are:
- If the scenario reproduces locally, use a performance profiler like PerfView , dotTrace , ANTS perf profiler , or with Visual Studio on your development machine.
- In production, the easiest way to profile is to use an Application Performance Monitoring (APM) tool like Azure Application Insights profiler or RayGun .
- You can profile production environments without an APM by copying an agent to the production machine and recording a snapshot. With PerfView, you should copy the entire program. It’s compact and requires no installation. With dotTrace, you can copy a lightweight Agent that allows recording snapshots in production.
- In .NET Core 3.0+ apps you can install .NET Core 3.0 SDK and use the dotnet-trace command-line tool to record a snapshot , then copy it to a development machine with PerfView and analyze.
2. Check Garbage Collector usage
I’d say the single most important thing about optimizing .NET CPU usage, is correct memory management. And the important question to ask in this regard is: “how much CPU is wasted on garbage collection?”. The way GC works is that during collection, your execution threads are frozen. This means that garbage collection directly affects performance. So if you’re CPU-bound, one of the first things I’d advise you to check is the performance counter .NET CLR Memory | % Time in GC.
There isn’t a magic number I can give you that indicates a problem, but as a rule of thumb when this value is over 20% then you might have a problem. If it’s over 40%, then you definitely have a problem. Such a high percentage indicates GC Pressure and there are ways to deal with that .
3. Use Array and Object Pools to re-use memory
Allocation of arrays and the inevitable de-allocation can be quite costly. Performing these allocations in high frequency will cause GC pressure and consume a lot of CPU time. A great way to deal with this is to use the built-in ArrayPool and ObjectPool
(.NET Core only). The idea is pretty simple. A shared buffer for arrays or objects is allocated and then reused without allocating and de-allocating new memory. Here’s a simple example of using ArrayPool:
public void Foo()
{
    var pool = ArrayPool<int>.Shared;
    int[] array = pool.Rent(ArraySize);

	// do stuff

    pool.Return(array);
}
4. Move to GC Server mode
We already talked about moving to GC Workstation Mode to save memory. But if you’re CPU-bound, then consider switching to Server Mode to save CPU. The tradeoff is that Server mode allows a higher throughput at the cost of more memory. So if you stay with the same throughput, you’ll end up saving CPU time otherwise spent by garbage collection.
A .NET server will most likely have GC Server mode by default, so this change is probably not needed. But it’s possible someone changed it to Workstation mode before, in which case you should be careful about changing it back since they probably had a good reason.
When changing, make sure to monitor memory consumption and % Time in GC. You might want to look at the rate of Gen 2 collections, though if this number is high it will be reflected in a higher % Time in GC.
5. Check other processes
When trying to bring your server to its best limit, you’ll probably want to be thorough about it, and that means not discarding that problems exist outside of your process. It’s very possible that other processes consume a bunch of CPU from time to time and cause a spiral of bad performance for a while. These could be other applications you deployed on IIS, periodic web jobs, something triggered by the OS, an antivirus program, or a thousand other things.
One way to analyze this is to use PerfView to record ETW events in the entire system. PerfView captures CPU stacks from all processes. You can run it for a very long time with a small performance overhead. You can stop collection automatically when reaching some CPU spike and dig in. You might be surprised by the result.
Wrapping up
Dealing with performance issues at scale from a top-down level is fascinating in my opinion. You might have a team spending months optimizing a piece of code and in comparison, a simple change in resource allocation will make a bigger impact. And if your business is big enough, this small change translates to a whole lot of dollars. Did you remember to ask for a commission clause in your contract? Anyway, I hope you found this article useful, and if you did, you might be interested in my book Practical Debugging for .NET developers where I talk in-depth about troubleshooting performance and memory issues. Cheers.


