Demystifying Memory Profilers in C# .NET Part 2: Memory Leaks

One of the biggest memory-related problems and I daresay all-round problems in .NET, are memory leaks. They are very common, hard to notice, and eventually lead to devastating consequences. These include out-of-memory crashes, high memory consumption, performance issues, and unnecessary “live” objects that keep executing code. The main tool to detect and fix memory leaks is a Memory Profiler. In fact, I believe the most common usage of memory profilers in .NET is exactly for the purpose of fixing memory leaks.
In the first part of this series, we saw how memory profilers work, and what kind of abilities they have. We saw that they can show an application’s memory in real-time or investigate captured snapshots. Some profilers are able to import dump files . We saw that memory profilers can show all the objects in memory, their size, who they reference, who references them, and their shortest path to a GC root. That path to root is important for memory leaks because it shows why those objects weren’t garbage collected.
In this article, you’ll see exactly how to use memory profilers to find the leaky objects, why they are still referenced, and how to solve the problem.
Defining Memory Leaks
In a garbage-collected environment, the term memory leak is a bit counter-intuitive. How can my memory leak when there’s a garbage collector that’s supposed to take care of collecting any unused piece of memory?
There are two related core causes of this. The first core cause is when you have objects that are still referenced but are effectually unused. Since they are referenced, the GC won’t collect them and they will remain forever, taking up memory. This can happen, for example, when you subscribe to events but never unsubscribe. This is called a Managed memory leak.
The second cause is when you allocate unmanaged memory (without garbage collection) and don’t free it. This is a Native memory leak. This type of leak is easier to cause from managed code than you would think. .NET itself has a lot of classes that allocate unmanaged memory— almost anything that involves streams, graphics, the file system, and network calls use native resources under the hood. These classes usually implement the dispose pattern , which means that a memory leak will be created if both of the following conditions occur:
- If you don’t call the
Disposemethod. - If you cause a managed memory leak that prevents the managed class from being collected.
But more on that later.
Memory Leak Example
Let’s look at this simple code. Below we have the class StzockMarketManager with a single event and StockActionWindow that registers to that event in the constructor.
public class StockMarketManager
{
    public event Action<StockChangeEvent> StockChanged;
    // ...
}

public class StockActionWindow
{
    public StockActionWindow(StockMarketManager manager)
    {
        manager.StockChanged += OnStockChanged;
    }

    private void OnStockChanged(StockChangeEvent ev)
    {
        // ...
    }

    public void DoSomething()
    {
        // ...
    }
}
Let’s suppose StockMarketManager is alive throughout the entire application lifetime. Whereas StockActionWindow is a window that is shown to the user for a short period of time. Take the following method for example:
public override void Foo()
{
    var actionWindow = new StockActionWindow(_stockMarketManager);
    actionWindow.Show();
    actionWindow.DoSomething();
    actionWindow.Close();
    // actionWindow is never used again
}
This looks like innocent code, but actually something bad happened here. We created a new StockActionWindow and called actionWindow.DoSomething(). Since we never use the actionWindow instance again, it’s supposed to be garbage collected, right? But StockActionWindow registered to the StockChanged event in its constructor, so it’s now referenced by StockMarketManager and is never going to be collected. This is a memory leak. Besides the memory taken by this instance, there’s also the possibility of incorrect behavior. The method OnStockChanged is going to be called on each StockChanged event, which might lead to undesirable effects.
When to Suspect Memory Leaks
The most notable sign that you have big memory leaks is when your application’s memory rises over time, without going back down. In a perfect application, when an operation has finished, the app returns to an idle state, and all objects are collected by the GC (eventually). With memory leaks, each operation leaves some objects referenced forever, making the memory increase over time.
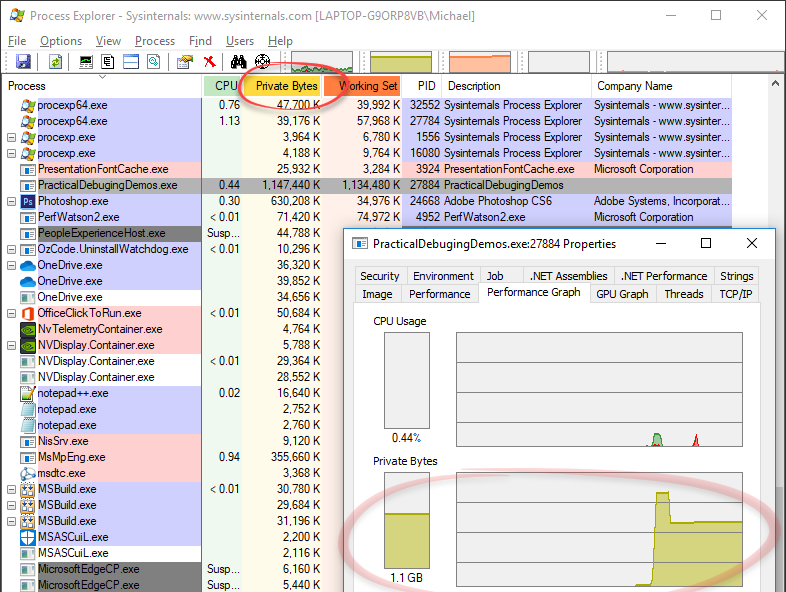
Monitoring for memory is a bit tricky. Task Manager’s memory indicator is Working Set, which is the physical memory taken by the process. It’s unreliable because it includes memory-mapped files and shared memory. Still, if it’s steadily rising then there’s a high chance a memory leak exists. The better way to monitor memory is with the performance counter Process | Private Bytes, which can be seen with PerfMon or with Process Explorer .
Watching those indicators will indicate big memory leaks, but you might have small leaks that will seem negligible when looking at overall memory usage. These won’t have a performance or memory impact, but they will leave “live” objects that shouldn’t be there and can cause errors in functionality. A memory profiler is the best tool to detect these kinds of leaks.
Memory leaks are extremely common in stateful applications, like in desktop applications. Stateless applications, like most web servers, are less prone to leaks because they usually don’t leave anything behind after a request finished. If you have a big WPF/WinForms app that was in development for 10 years, I pretty much guarantee that you have memory leaks.
Use a Memory Profiler to Find Memory Leaks
The best way to find exactly which objects are leaking is with a memory profiler. The quickest and most effective technique is to compare two snapshots where the application should have returned to the same memory state, but didn’t. The first snapshot is taken before an operation with the potential leak, and another snapshot is taken after the operation.
Here are the steps to do this:
- Start with some kind of idle state in your application. This could be the Main Menu or something similar.
- If you didn’t start the process with the profiler, attach the memory profiler now. Alternatively, you can work with memory dumps.
- Take a memory snapshot or capture a dump file .
- Run the scenario where you suspect a memory leak occurs. Return to the idle state at the end of it.
- When in the idle state again, take a second snapshot, or capture a second dump file.
- Compare both snapshots (or dumps) with your memory profiler. Ideally, the number of instances should be more or less the same. Look for instance-count differences and size differences. Most profilers can divide the objects to “Survived instances” (unchanged) and “New instances”. The new instances are the memory leak. Those instances should have been garbage collected, but weren’t (memory profilers force full garbage collection when capturing a snapshot). In most profilers (except Visual Studio), you can explore just the “New instances” and see who references them. This will show the root cause of the leak.
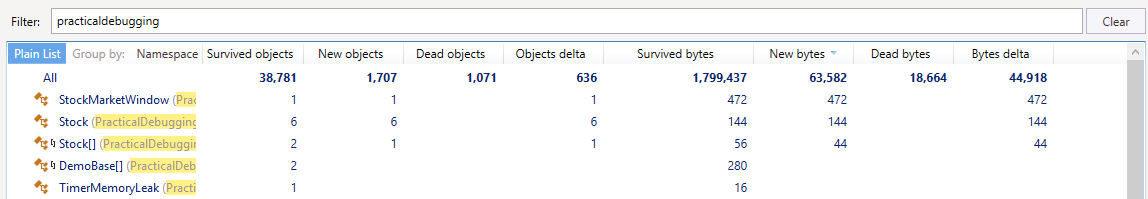
It’s usually effective to sort the instance differences by size (instead of by count) and start looking for the largest leaks. Another method is to filter to namespaces and assemblies of your own application code, as shown in the image above where it’s filtered to the namespace practicaldebugging....
Another way to find memory leaks is to take a snapshot and manually go over the objects. Look for suspicious types that shouldn’t be in memory. This is harder, involves some guesswork and deep knowledge of your application.
Once you find the leaky objects, the next step is to find out why they weren’t collected. Go over the New objects instances and see the Shortest path to root.
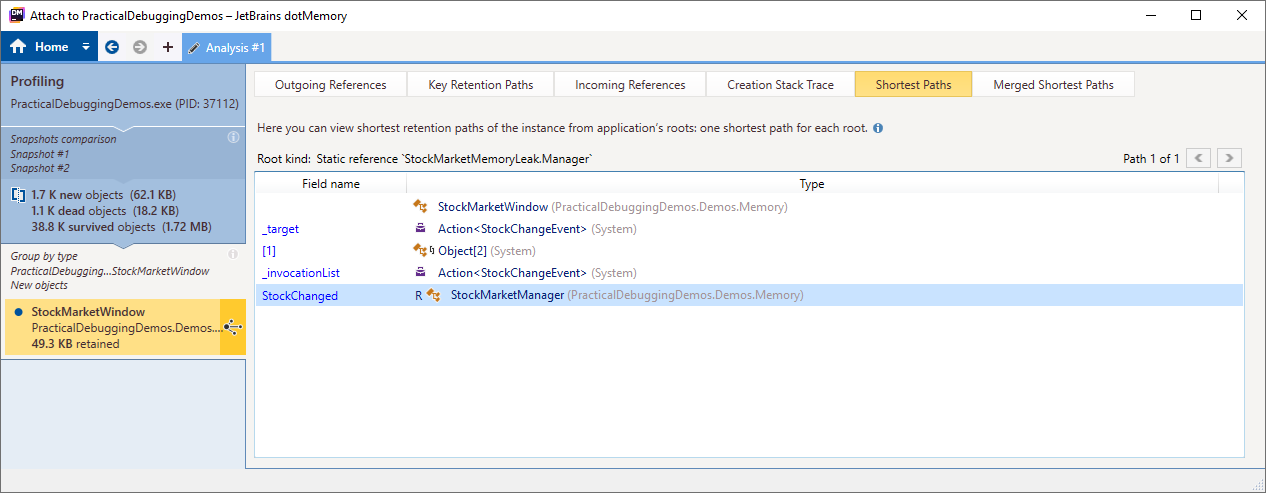
NOTE: dotTrace also has the “Key Retention Paths” feature that shows multiple paths to GC root. Some leaky objects are held in several ways, which just makes our job a little harder.
You can see that StockMarketWindow is referenced by StockMarketManager‘s event StockChanged. Now that we found the problem, it’s just the simple matter of fixing it. In this case, we can unsubscribe from the StockChanged event once the StockMarketWindow is closed:
public StockMarketWindow(StockMarketManager manager)
{
    manager.StockChanged += OnStockChanged;

    //unsubscribing and solving the memory leak
    this.Closed += (s, e) => manager.StockChanged -= OnStockChanged;
    //...
}
Memory Leak Common Causes
Some patterns in C# have a tendency to lead to memory leaks. Some of those are:
- Subscribing to events
- Capturing members in lambdas/delegates
- Caching systems
- WPF-specific issues
- Timers that didn’t terminate
To find out more about those patterns, as well as more information on native memory leaks and the dispose pattern , check out my article 8 Ways You can Cause Memory Leaks in .NET .
Summary
In this article, we saw how to use memory profilers to fix memory leaks. They are the most effective tool for the job and show the exact reason why the leaky objects weren’t collected.
In the next part of this series , we’ll see how to deal with the second-biggest memory offender in .NET: GC Pressure. We’ll see how the garbage collector can cripple your application’s performance, why this happens, and most importantly how to fix this. A little spoiler though— we’ll be using memory profilers.
Resources:
ne - Find, Fix, and Avoid Memory Leaks in C# .NET: 8 Best Practices