10 Essential Debugging Tools for C# .NET Development

When it comes to debugging software, tools are extremely important. Get the right tool and you extract the right information. Get the right information and you can find the root cause of the issue. Find the root cause and you’ve solved the bug.
You’re about to see a biased list of what I believe to be the most essential tools to investigate problems in C# .NET. These will help you get to the root cause of any difficult problem and fix it.
Besides regular problems in code, the following tools handle a variety of problem types including:
- Performance issues
- Memory issues (GC Pressure and Memory Leaks )
- Issues with 3rd party libraries ,
- Issues in Production
- Issues with Network
1. Visual Studio
Our main tool when it comes to debugging is Visual Studio. It’s one of the best IDE’s in the world and not just in the .NET space. It has a ton of features to help you debug including various tool windows, exception options, tooltips, and much more . Microsoft managed to incorporate both basic and advanced features into a pretty intuitive program, making Visual Studio the second most popular IDE for all developers according to the StackOverflow survey of 2019.
In recent years, two competitors appeared to challenge the .NET IDE spot: Rider and Visual Studio Code . From my experience, both are still very much behind Visual Studio in debugging capabilities. Although Rider’s refactoring features and performance are very impressive.
Besides interactive (traditional) debugging, VS includes a bunch of other analysis tools:
- Performance Profiling
- Memory Profiling
- Historical Debugging with IntelliTrace
- Cloud Debugger (as part of Cloud Explorer)
I prefer using other tools for all of the above categories. Read on, they’re on the list.
2. dnSpy
dnSpy is one of the most useful tools for .NET debugging. It’s a good decompiler, but its main usage is as a debugger. dnSpy allows you to debug any .NET assembly, regardless of having symbols or source code.
This tool looks and feels like Visual Studio. When you start debugging a .NET process without symbols or source code, dnSpy shows you the decompiled code. Now here’s the magic: You can place breakpoints in the decompiled code itself. When these breakpoints hit, you’ll see local variables, threads, call stack, and have a full debugging experience. This makes dnSpy my favorite tool to debug 3rd-party code and to debug a production environment.
It’s lightweight and requires no installation. Just copy the folder to any production machine and start debugging.
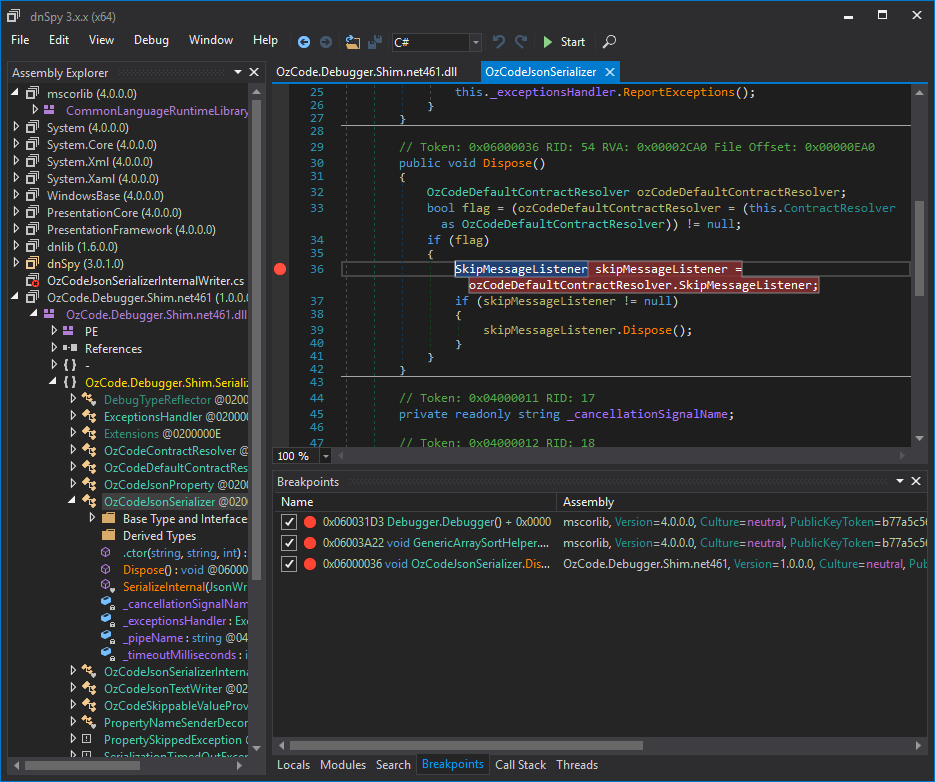
There’s a little trick with this tool. If you start a process with dnSpy, everything will work well. But if you attach to a running process, the Modules that were already loaded will stay optimized. That is if they were built in “Release” mode. When the code is optimized, some breakpoints won’t be hit and some local variables won’t be shown. This pretty much ruins the debugging experience. The solution is just to start a process with dnSpy instead of attaching.
3. dotPeek
dotPeek is a free .NET decompiler by JetBrains. A bunch of their tools made their way into this list actually. I prefer dotPeek over other decompilers like ILSpy or JustDecompile because of two reasons:
- dotPeek offers a better user experience. Or at least one that I feel more comfortable with. It looks and feels like ReSharper , so that might be the reason.
- dotPeek can create a symbol server from any assembly, even without symbols or source code. It’s kind of like dnSpy that way – it decompiles the code and creates symbols from that. With dotPeek, Visual Studio can debug any 3rd party code, just like dnSpy. To see how exactly, see my article: Debugging 3rd Party .NET Code without symbols in Visual Studio
4. dotTrace
dotTrace is another great tool by JetBrains. It’s my favorite performance profiler. dotTrace allows you to “record” an application run and then analyze the performance of the recording. You’ll be able to see how much time was spent in each of the called methods, time spent by database calls, by HTTP requests, during garbage collection and so on.
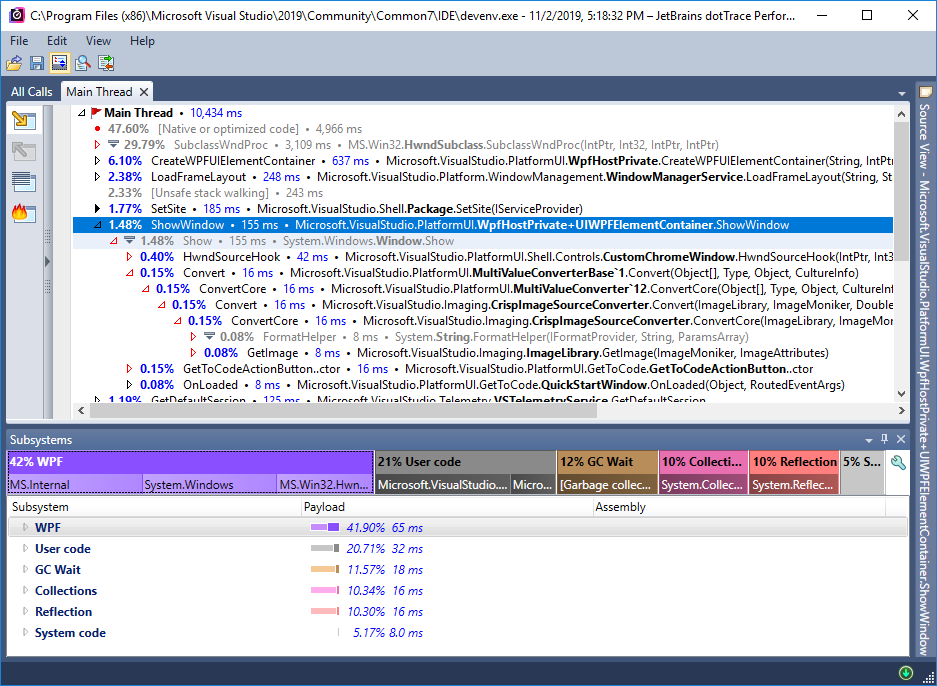
The above image shows a short recording analysis of Visual Studio. You can see that ShowWindow took 155 milliseconds, which include the methods HwndSourceHook (42ms), Convert (16ms), and so on. This method’s execution consists of 42% WPF calls, 20% user code, 12% GC Wait, 10% Collections code, 10% Reflection, and 5% system code. Pretty great, right?
It’s a bit of a learning curve at first, but once you get used to it, it becomes very intuitive.
5. SciTech’s .NET Memory Profiler
A memory profiler is another category of tools that’s essential to solve memory problems. These might be memory Leaks or performance effects caused by the GC (GC Pressure ). If you’ve got a big enough application, then you’ll run into memory issues sooner or later. I hope later for your sake because these types of problems can be devastating.
A memory profiler can take a “memory snapshot” and let you investigate it. You’ll see which objects take the most memory, who references them, and why they weren’t garbage collected. By comparing two snapshots you can find memory leaks .
There are several memory profilers available, but SciTech’s .NET Memory Profiler is my favorite. I found It’s the most powerful one and has the fewest problems.
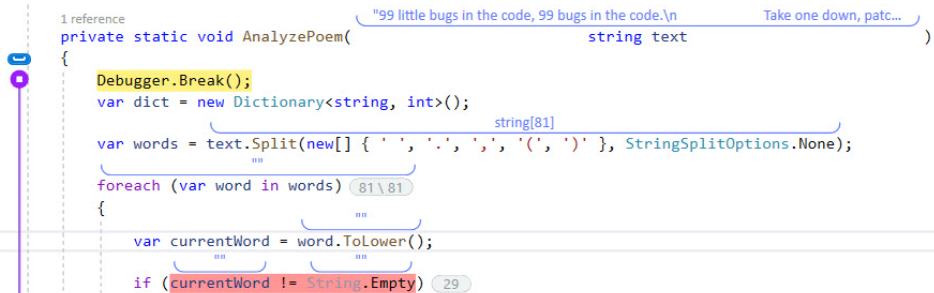
6. OzCode
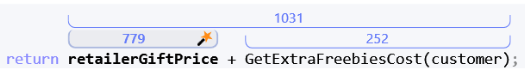
OzCode is a unique Visual Studio extension. Its sole purpose is to help your interactive debugging in Visual Studio. OzCode has a big group of features, that can be categorized into 4 parts:
-
Heads-up display – OzCode adds some helpful visualization features during debugging. This includes red/green highlighting and showing chosen properties of an object:
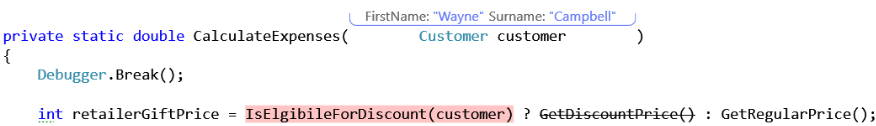
There are other things, like breaking down an expression into its parts:
-
LINQ Debugging – LINQ is great while writing code, but very hard to debug. OzCode allows investigating LINQ expressions during debugging in an almost perfect matter.
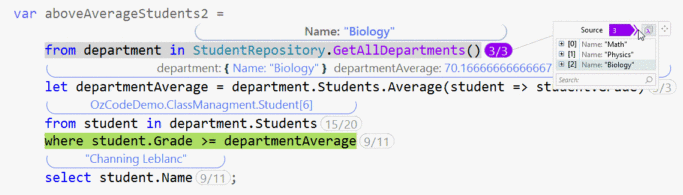
To learn more about debugging LINQ with or without OzCode, check out my article: How to Debug LINQ queries in C# .
-
DataTip – The DataTip is the popup window you get when hovering over variables in Visual Studio. OzCode replaces that window with its own, much better DataTip. It allows “favorite” properties, Search, Export to JSON and other features.
-
Time Travel – OzCode 4 added a new, revolutionary, debugging feature. It can predict the future without you moving the breakpoint. That is, you’ll be able to see what happens in a line of code that occurs after your current debugging position. This feature doesn’t work in all cases though. For example, OzCode can’t predict things like HTTP request results or SQL requests because it has to execute them for that.
7. SysInternals Suite
Sysinternals
is a suite of utilities to troubleshoot and monitor Windows software. It includes some of the most important tools we need for debugging. I suggest downloading the entire suite
and saving somewhere easily typed from the command line, like C:\Sysinternals. There are dozens of tools, some more useful than others. Let’s list a few of the most important ones for .NET:
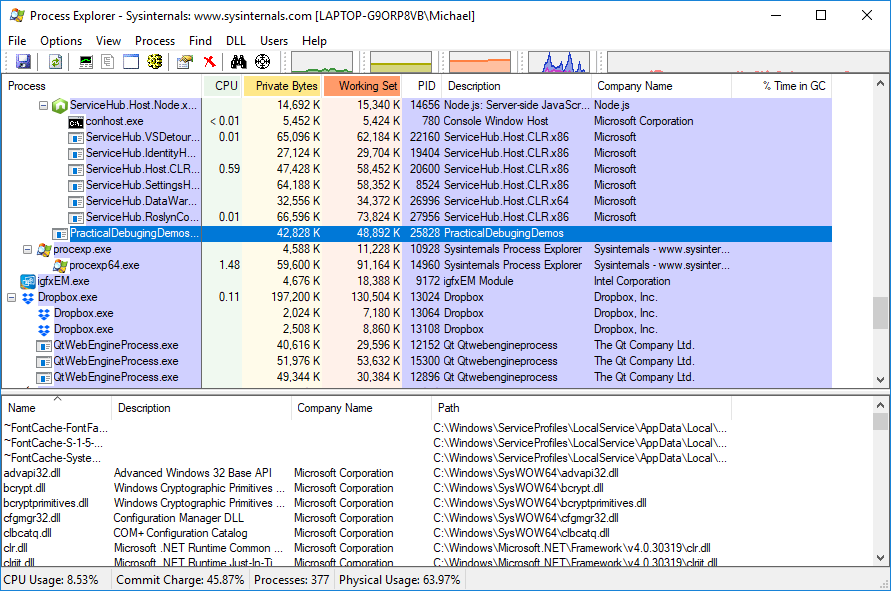
Process Explorer
Process Explorer is like the Windows Task Manager on steroids. It has a myriad of features useful for debugging. Here are some of them:
- View loaded modules
- View handles
- Create Dumps
- View process tree
- View performance counters
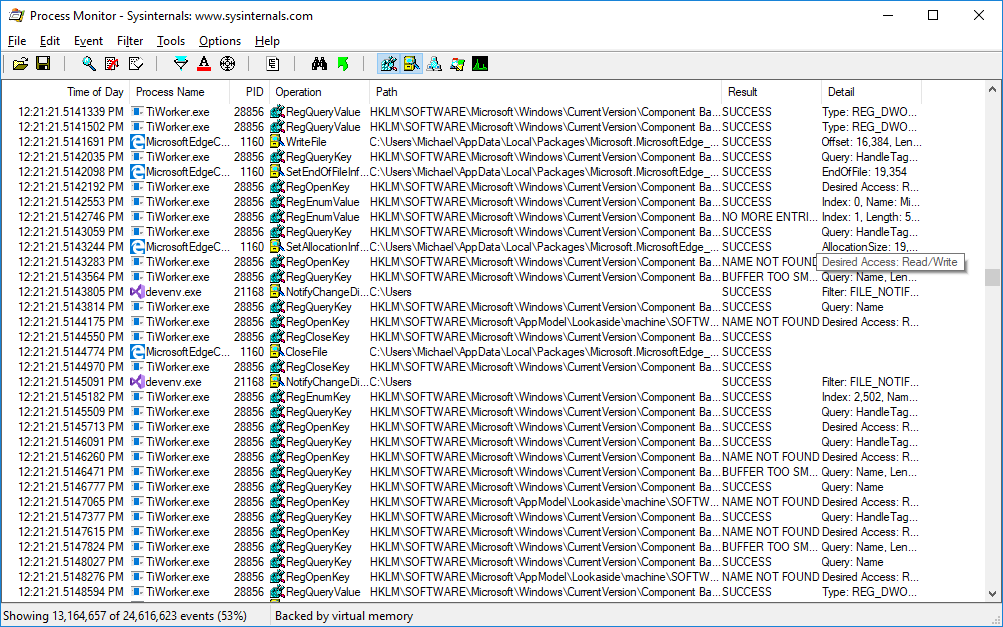
Process Monitor
Process Monitor, also known as ProcMon, allows you to monitor processes activity events. Specifically, you can see Registry events, File events, Network events, Thread activity, and Profiling events. If you want to find out which files or registry values your process touched, then ProcMon is the tool to help you.
ProcDump
ProcDump is a command-line tool for saving dump files. It can generate dumps immediately or on triggers. For example, creating a dump on a crash or a hang. It’s my recommended tool of choice for capturing dumps. Here are some of its abilities:
- Create a Dump immediately
- Create several dumps with specific intervals (like 3 dumps, 5 seconds apart)
- Create dump once a CPU threshold has passed
- Create dump if a process is hanged
- Create dump on crash
To find out more about ProcDump and Dumps, see my article: How to Create, Use, and Debug .NET application Crash Dumps in 2019 .
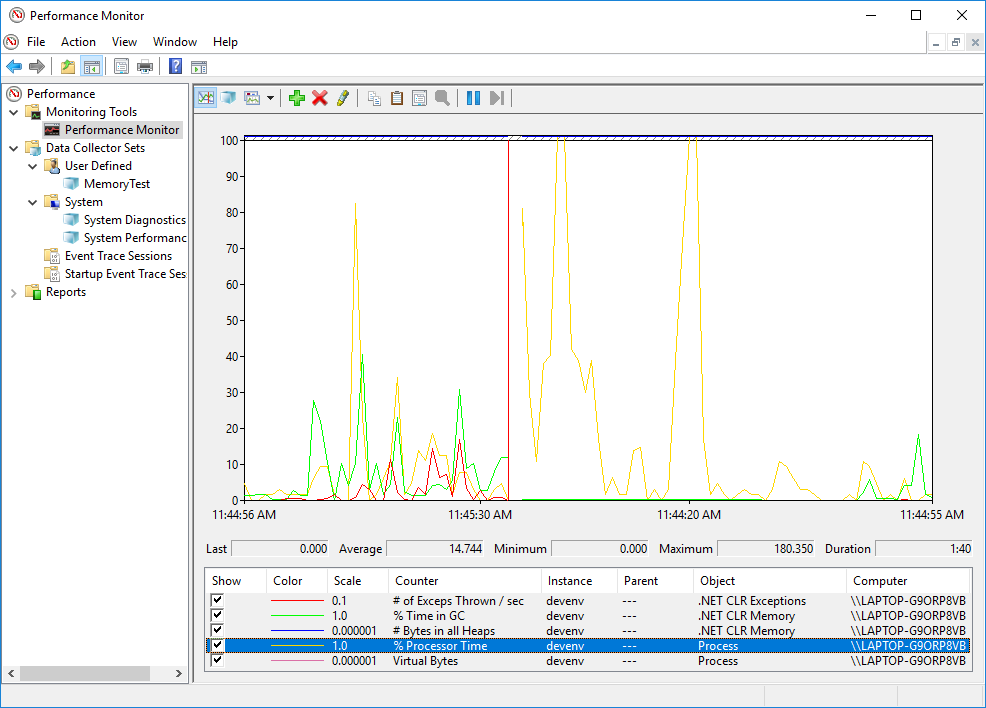
8. Performance Monitor (PerfMon)
There’s a built-in mechanism in Windows called Performance Counters . These counters allow you to follow a whole lot of useful metrics on what’s happening on the machine. Those might be system-wide metrics or for a specific process. Here are some examples of things you can measure with performance counters:
- CPU Usage
- Memory Usage
- Number of exceptions thrown in a process
- I/O Bytes read/written
- Number of requests to your ASP.NET application
- Request response time in your ASP.NET application
There are probably thousands of different counters you can monitor and they come as specific as possible. For example, if you want to find out about Memory Usage of a process, there are counters for: Private Bytes, Virtual Bytes, Working Set, Working Set – Private, Gen X Collections, % Time in GC, Large Object Heap Size, and many more.
Performance Monitor is the tool that allows you to visualize these counters (although there are other tools as well). It’s pre-installed with any Windows installation. To run it, just type “Performance Monitor” in your start menu or type perfmon in command prompt.
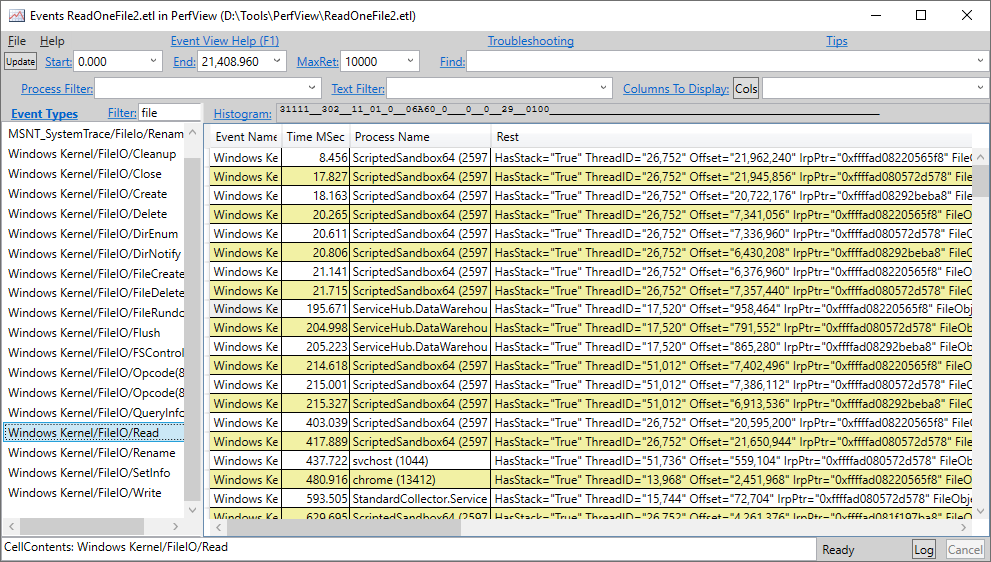
9. PerfView
PerfView is an open-source general-purpose analysis tool. It has a ton of things it can do, here are some of them:
- Performance Profiling
- Memory Profiling
- Analyze ETW events
- Import performance snapshots from Linux
- Various reports on application behavior, including JIT Compilation times, Garbage collection times, and others
Its analysis is based on Event Tracing for Windows (ETW) events. This is a built-in logging system that’s extremely fast and used by every part of Windows. Everything logs events to ETW, including the Kernel, Windows OS, the CLR runtime, IIS, ASP.NET framework, WPF, and more.
PerfView is easily the most complicated tool on this list. But it’s also very powerful. To get started with PerfView, I suggest watching Vance Morrison’s video lessons series on Channel 9 .
10. Fiddler
Fiddler a free tool by Progress Telerik. It’s one of my favorite tools to debug network calls. It’s defined as an HTTP proxy server and it’s just that. It captures all HTTP requests, logs the data, and sends the request on its way.
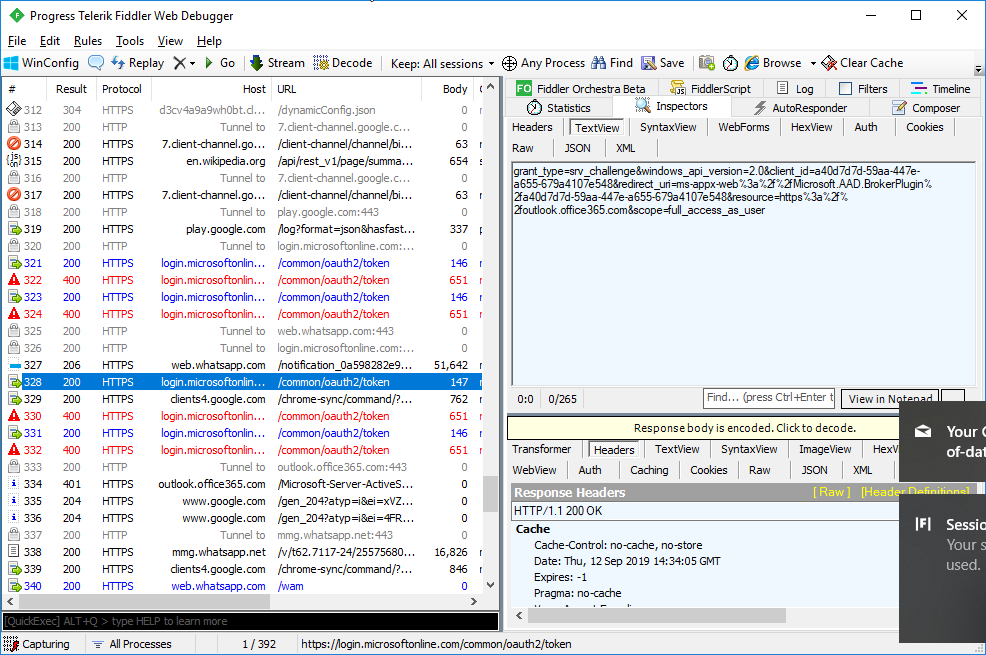
For each request, you can see the process, headers, payload, response, status. Well, everything.
For debugging, Fiddler has a couple of useful features:
- Replay requests – You can right-click any request and click “Replay”, which will send the exact same request again. It’s useful when debugging server-side problems. If you want to reproduce a problematic request, Fiddler saves you the trouble of re-running the scenario on the client to send the same request again. It also helps with requests that are hard to reproduce.
- Edit & Replay requests – Besides just replaying requests, Fiddler allows us to modify them. You can change the headers, body, and even the URL itself. You can use it to see how your server-side deals with edge cases. Or to reproduces a problem that happens on a specific request.
The one that wasn’t mentioned
You might wonder about some of the tools I didn’t mention. If you’ve been around long enough, you might think of WinDbg. If you’re not familiar with it, WinDbg is a command-line debugger that used to be the main debugging tool for Windows. Kind of like Visual Studio is now for .NET. I feel it’s not that relevant now in 2020 and going forward. At least not for .NET development. You can do almost everything with Visual Studio and it’s going to be easier and faster.
Some things are still better with WinDbg. Like its scripting capabilities, easy remoting, and convenient production debugging. You can copy WinDbg to a production machine and investigate dump files pretty quickly. It doesn’t require a big installation like Visual Studio. But I always find myself copying dump files to my development machine and opening them with a memory profiler or Visual Studio. It’s just more effective. So my verdict is that WinDbg is not an essential debugging tool for .NET development anymore.
Summary
We went over some of the best tools for debugging. In my opinion, knowing these tools is a crucial part of being a senior developer. Some of the ones mentioned can be replaced by similar tools in their category. For example, you might use dotMemory as a memory profiler or Visual Studio’s built-in profiler or even PerfView. Or you can use RedGate’s performance profiler instead of dotTrace.
Whatever you choose, knowing well at least one performance profiler is going to help you deal with difficult problems that you’d otherwise be stuck on. The same goes for memory profilers, production debugging tools (like dnSpy), decompilers, and the rest of them.
Happy debugging everyone.